

Repositories overview
When you navigate to/<your-org>/flaky-tests, you land on a repositories overview showing all monitored repositories at a glance.
Each repository row displays:
A quarantine status icon appears next to each repository name when quarantining is configured:
Active repositories (with test data in the last 30 days) appear at the top of the list. Repositories with no recent data are collapsed under an Inactive Repositories section that you can expand to view.
Selecting a repository opens its detailed dashboard. If your organization has no repositories connected yet, the page redirects to onboarding. See Quarantining to learn how to configure quarantine settings.
Key repository metrics


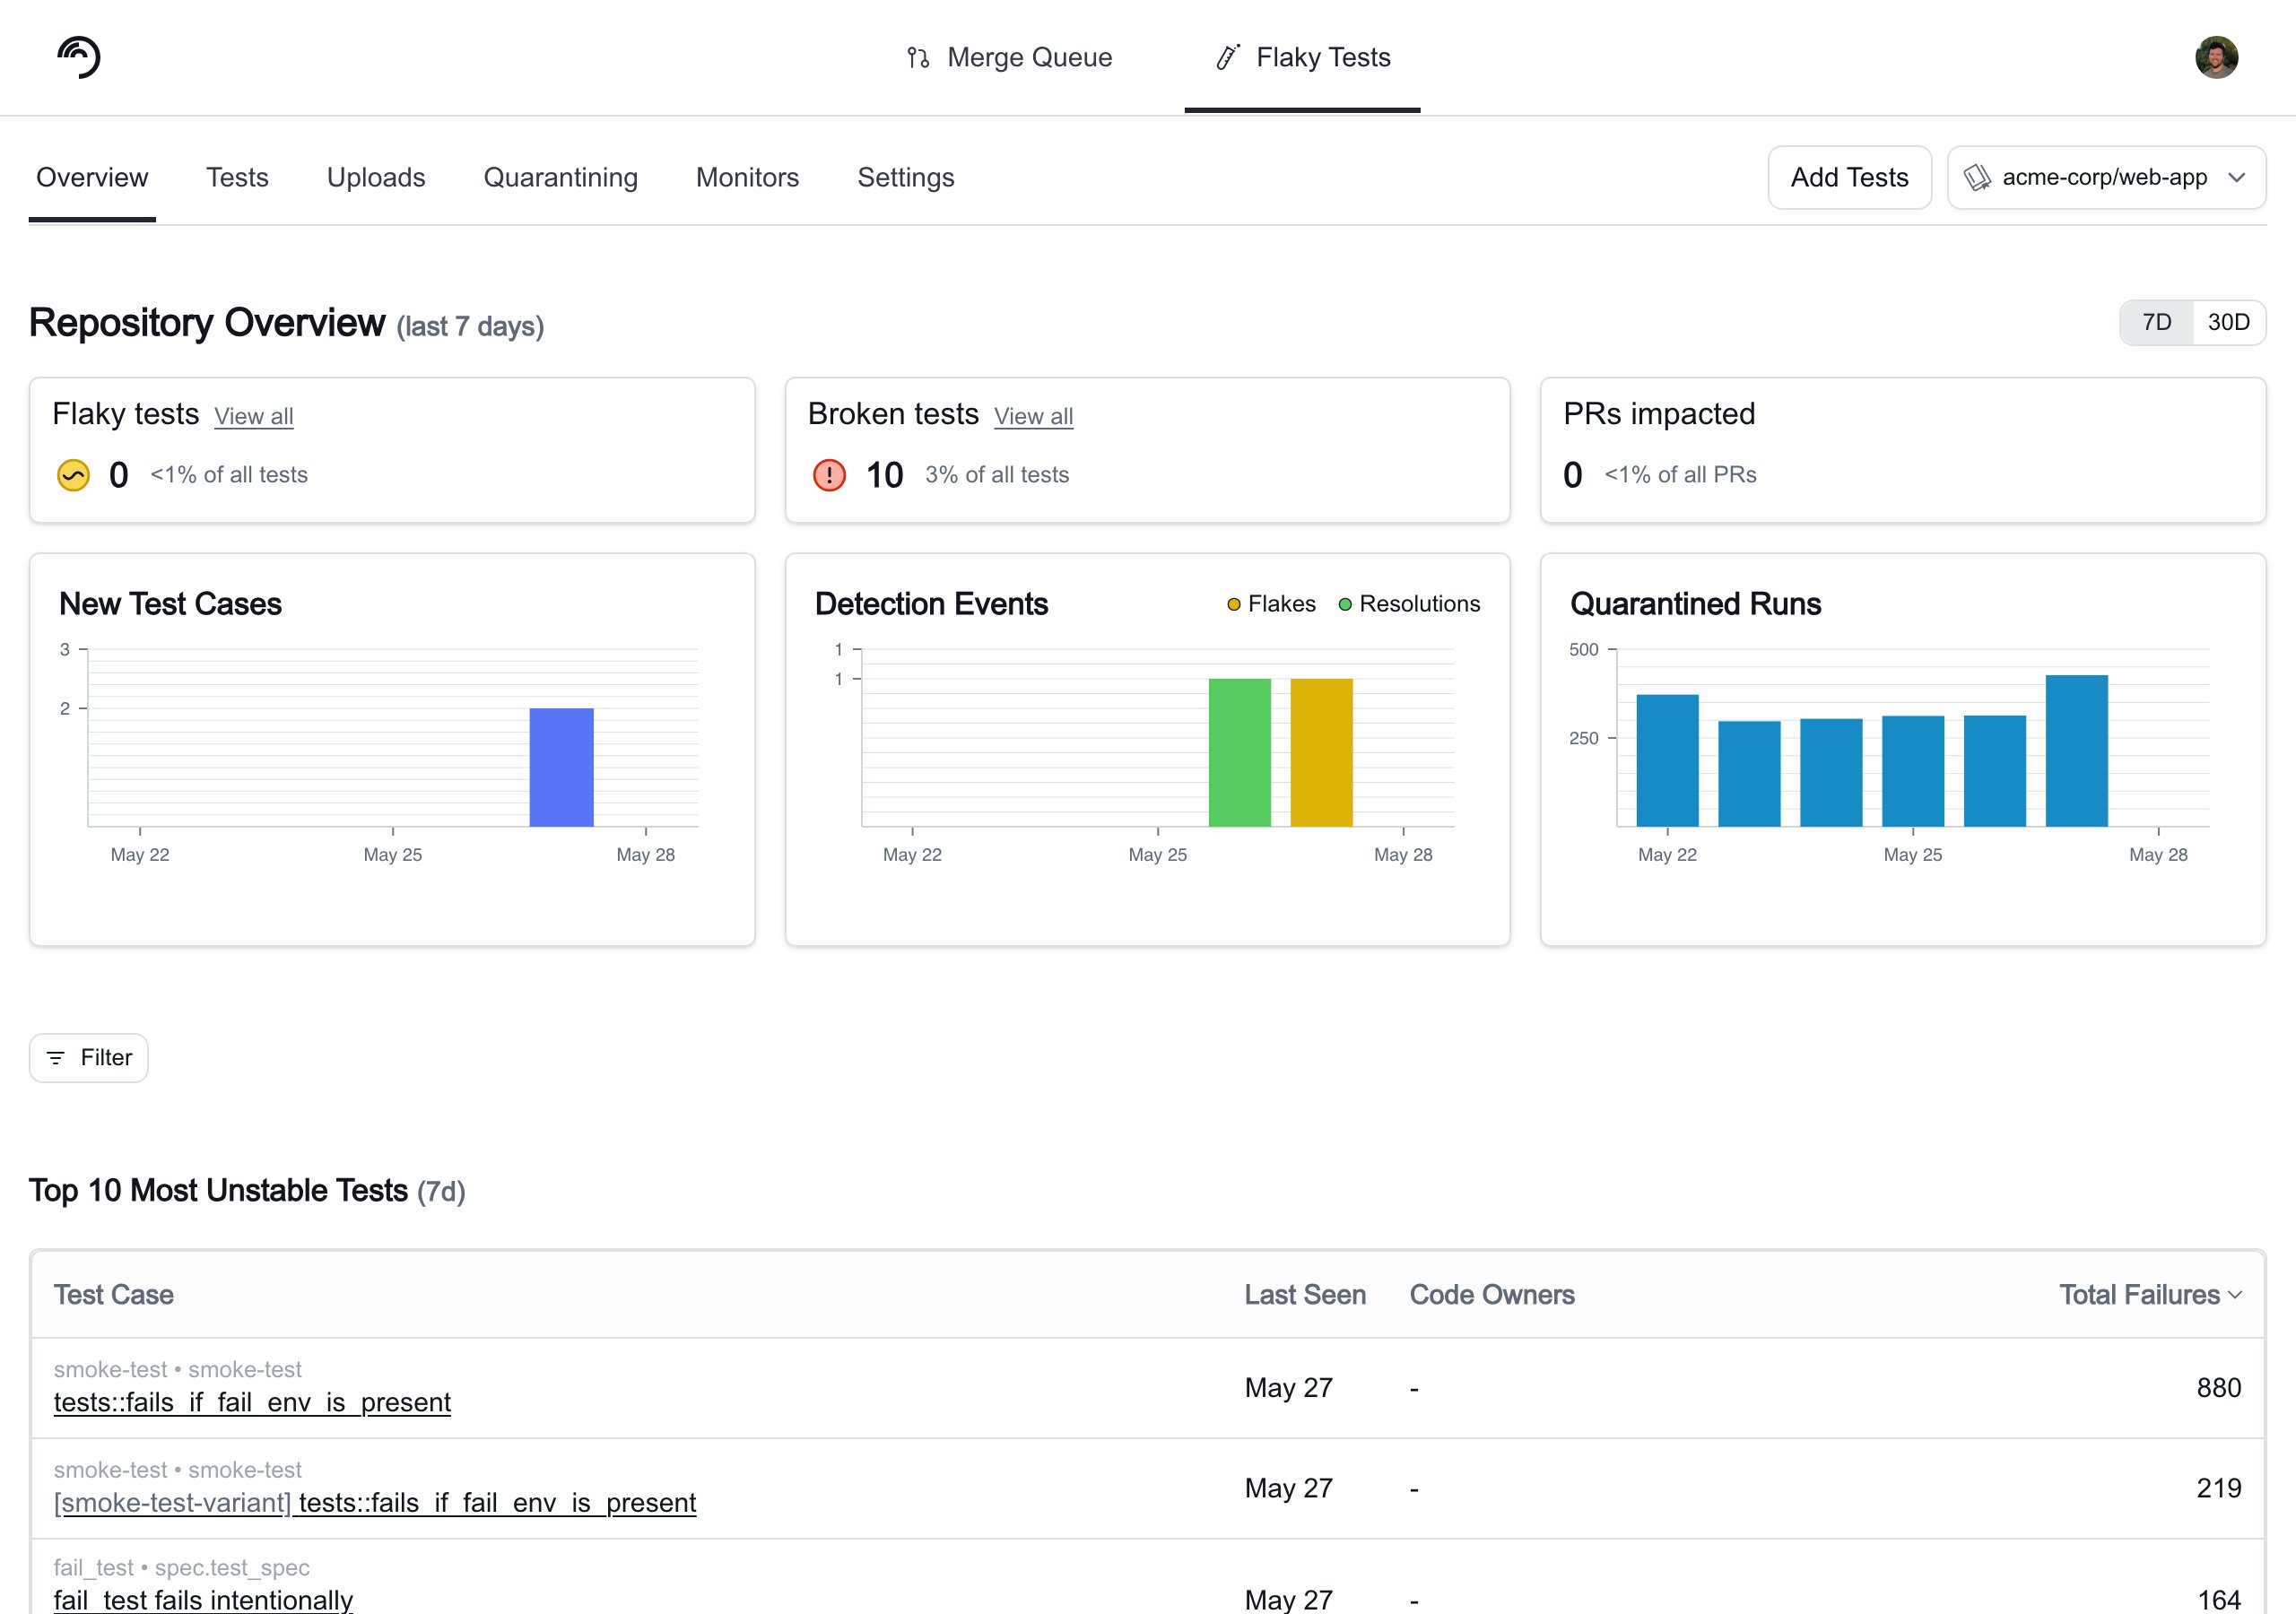
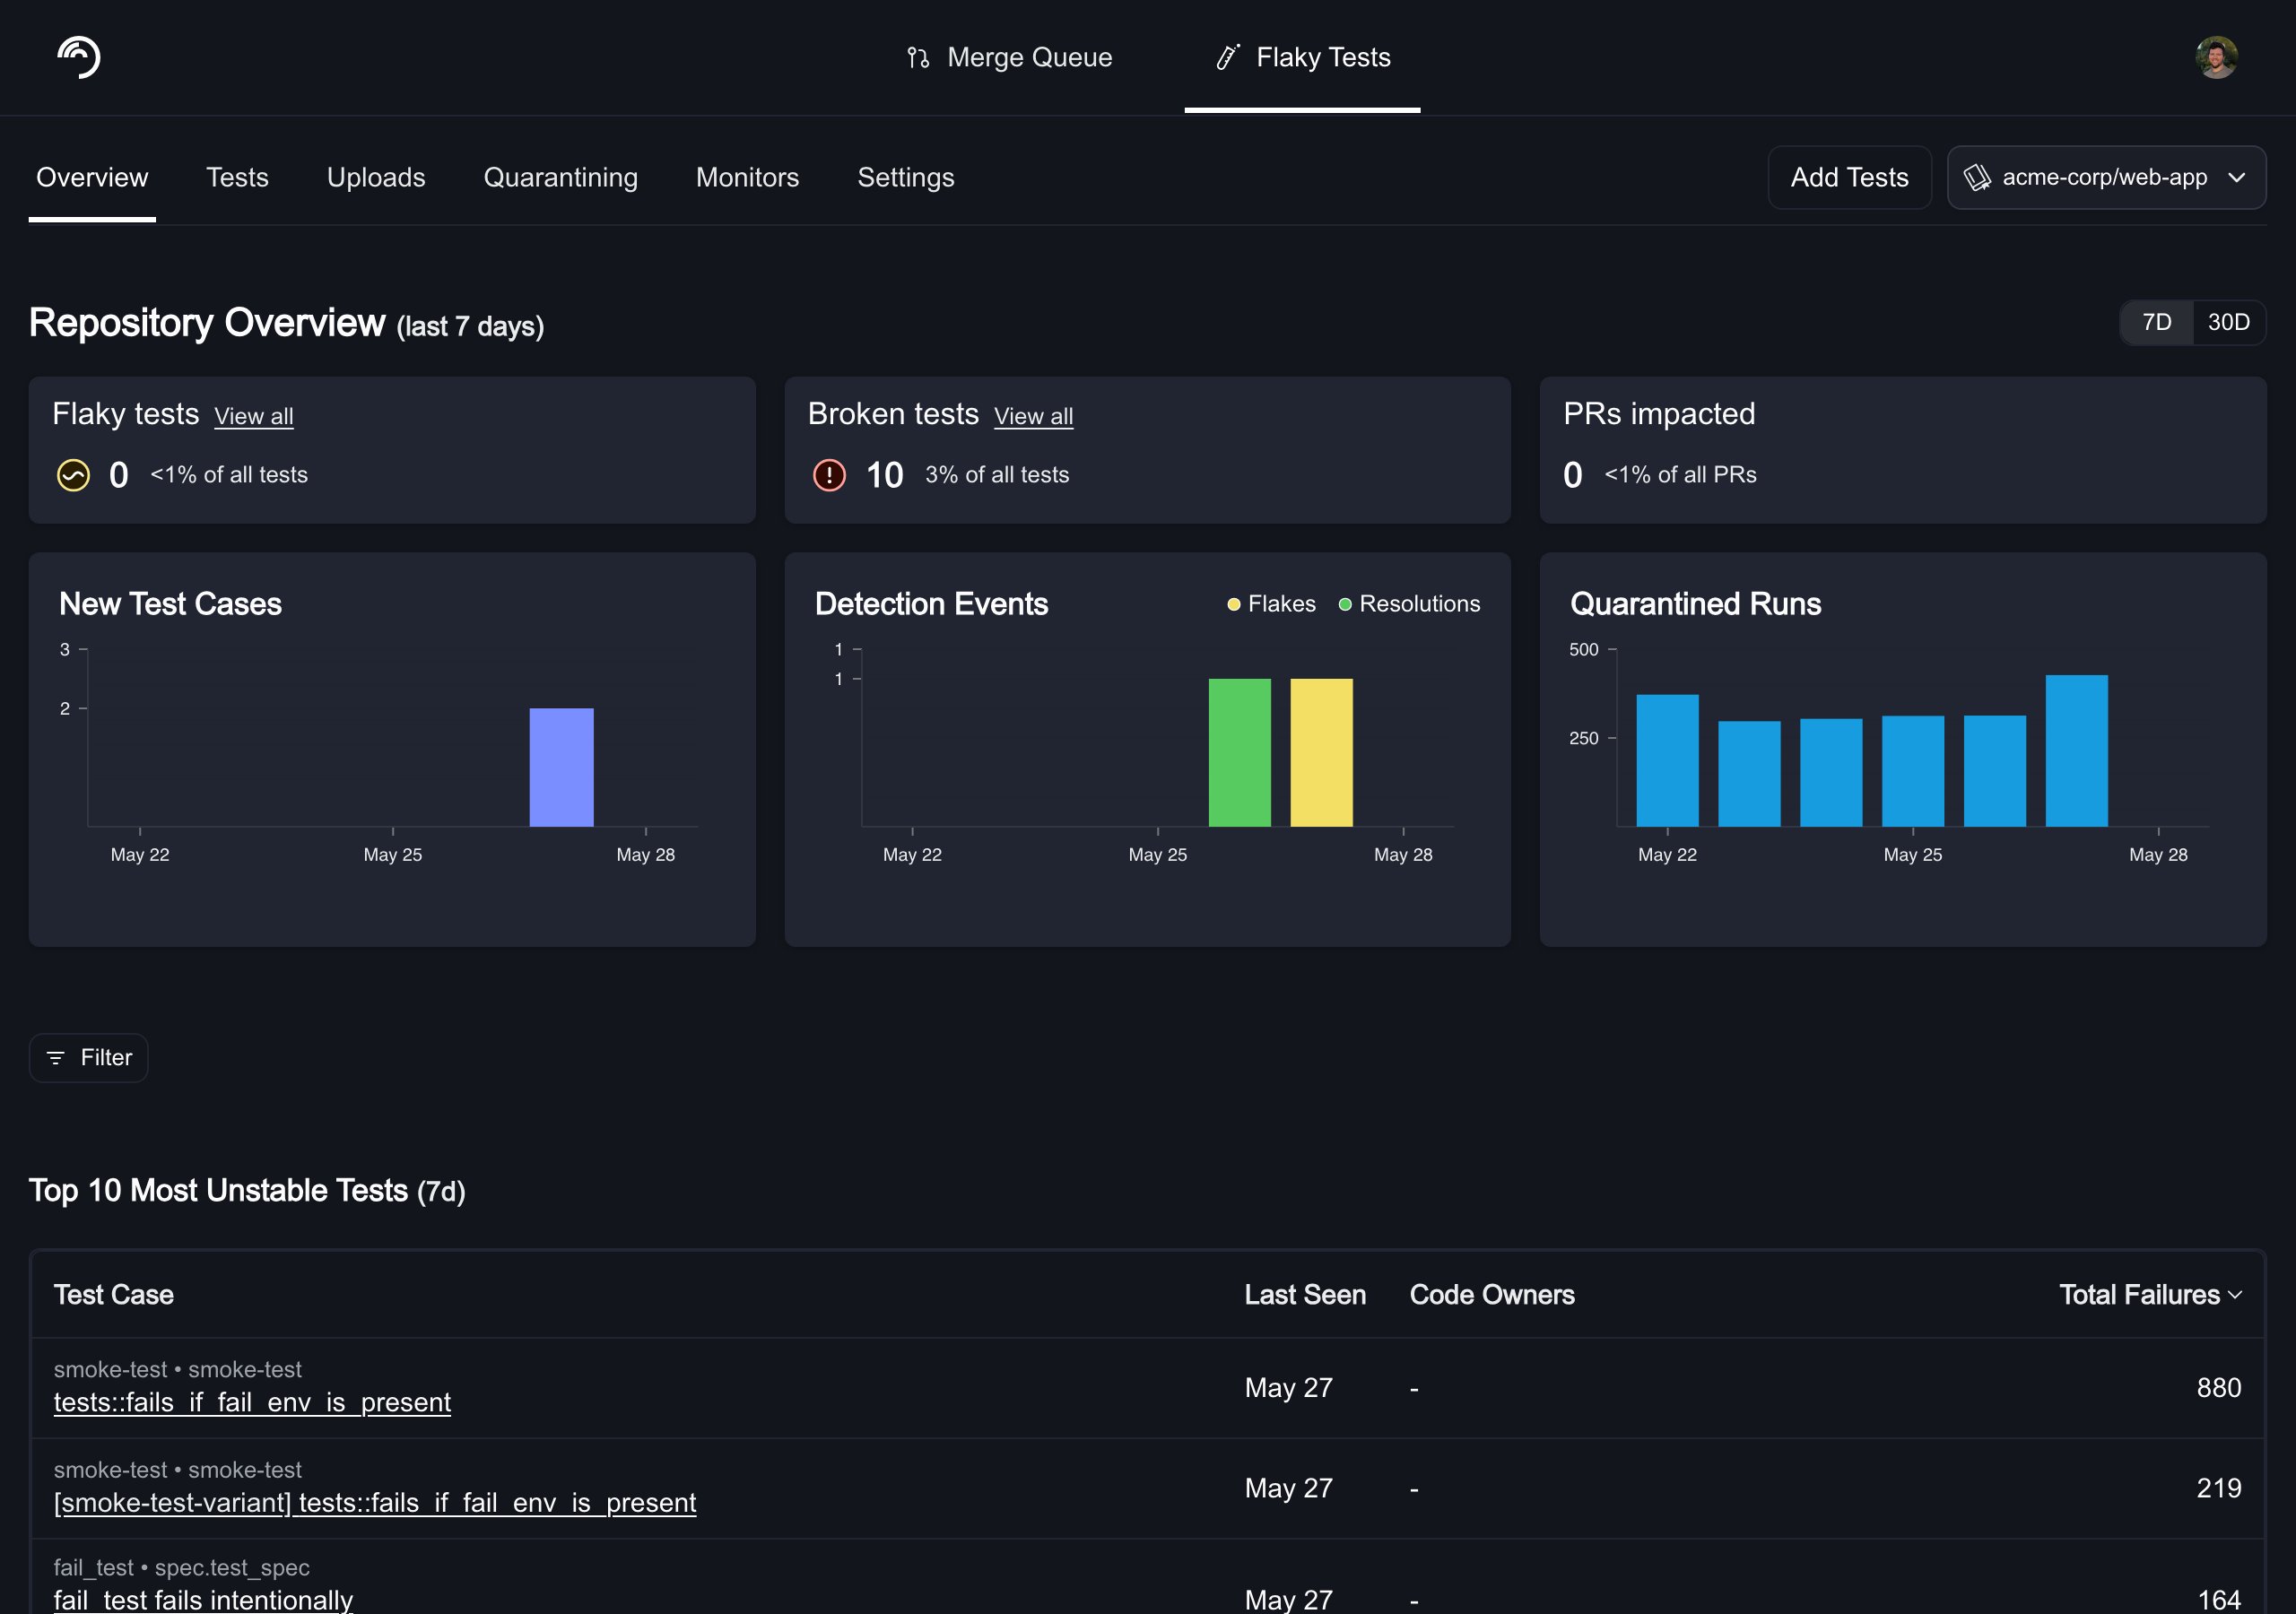
Key repo metrics
These numbers are important for understanding the overall health of your repo’s tests, how flaky tests impact your developer productivity, and the developer hours saved from quarantining tests. You can also view the trends in these numbers in the trend charts.
The trend charts display the New Test Cases added by day, as well as Test Transitions and Quarantined Runs. Test Transitions represent the number of tests that have transitioned to a particular status on a particular day, excluding new test cases (which default to a status of Healthy). If a bar shows 5 Healthy, 10 Flaky, and 2 Broken on a single day, that indicates 5 tests transitioned to Healthy, 10 to Flaky, and 2 to Broken on that day. Quarantined Runs represents the number of runs of quarantined tests by day.
Test cases overview
Test Deletion & History
- Inactive tests disappear from the dashboard automatically after 30 days and are fully removed after 45 days. Tests cannot be manually deleted.
- Changing test identifiers (e.g., adding file paths) creates new test entries — merging with old history isn’t supported.
Test case details
You can click on any of the test cases listed on the Flaky Tests dashboard to access the test case’s details. The test details page uses a tabbed layout:- Summary: Run result charts and failure types grouped by unique failure reason.
- Test History: A searchable, paginated table of every individual test run with filtering and a detail panel.
- Monitors: Detection monitors configured for this test (visible when the detection engine is enabled).
- Events: A timeline of detection events, quarantine actions, ticketing events, and status transitions (Healthy, Flaky, Broken) for this test (visible when the detection engine is enabled). Use the category filter to scope to Flake Detection events to see which monitor triggered each transition.
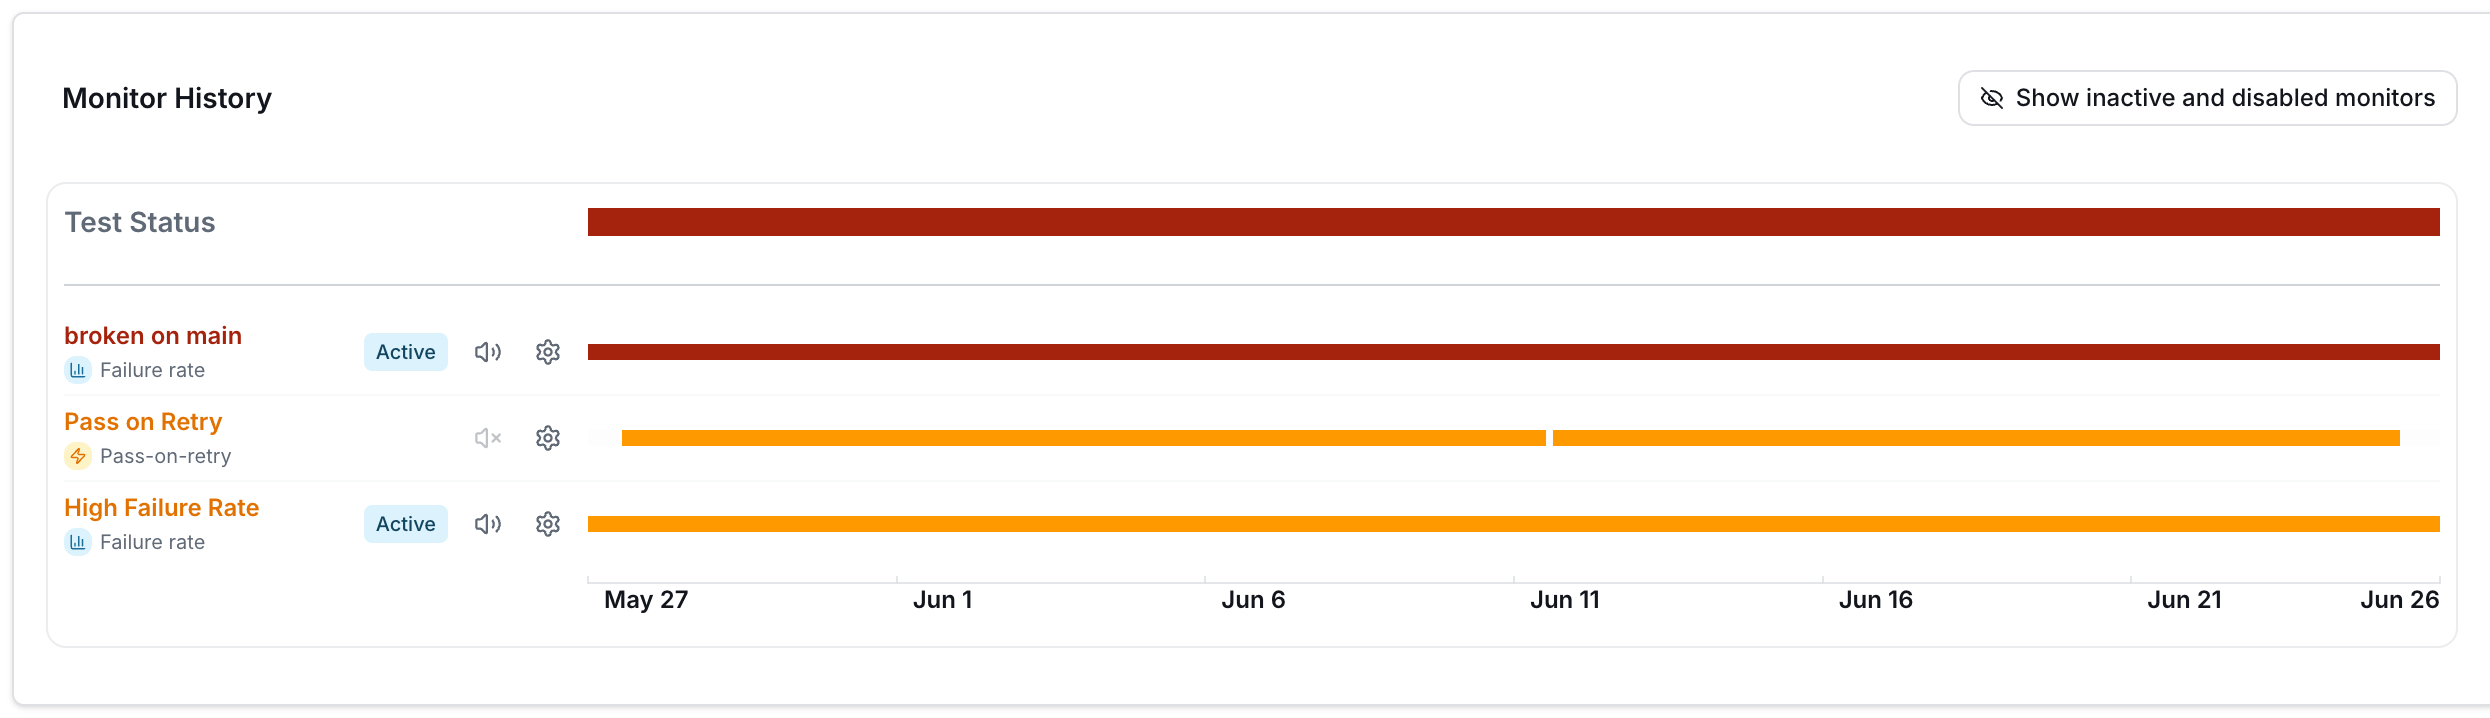
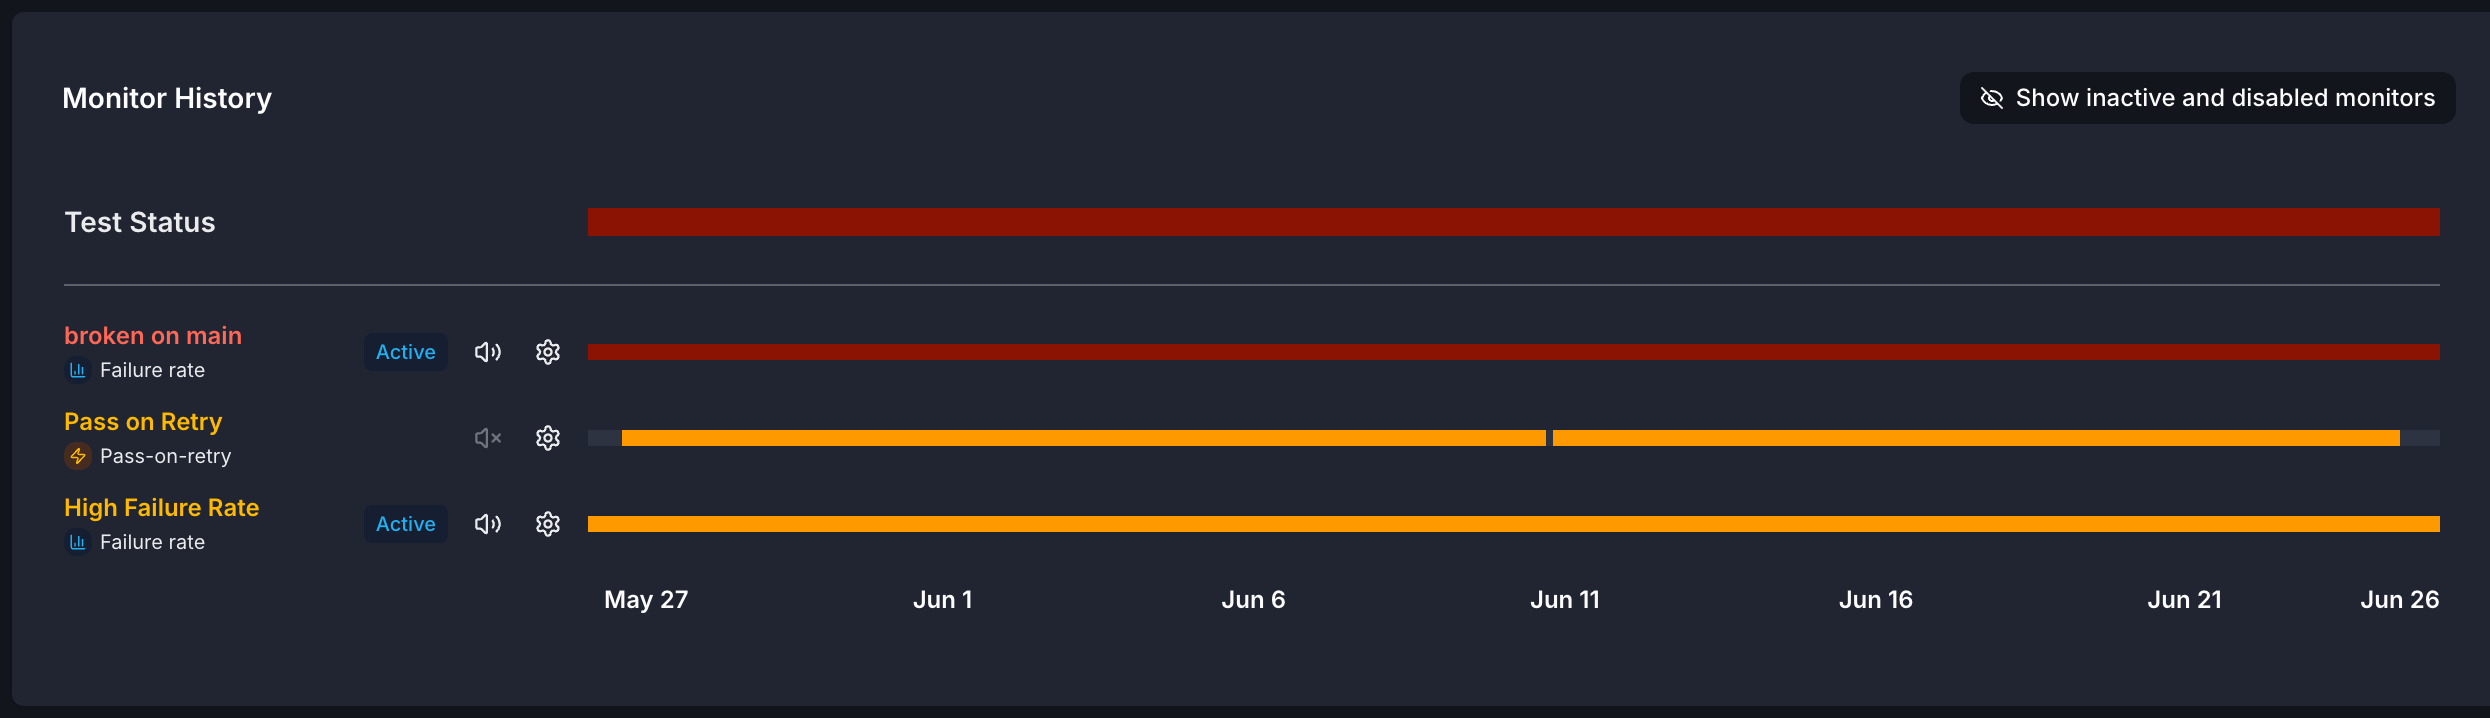
The monitor history swimlane on the Monitors tab: each monitor's classifications over the past 30 days, one row per monitor.
Code owners
If you have a codeowners file configured in your repos, you will see who owns each flaky test in the test details view. We support code owners for GitHub and GitLab repos.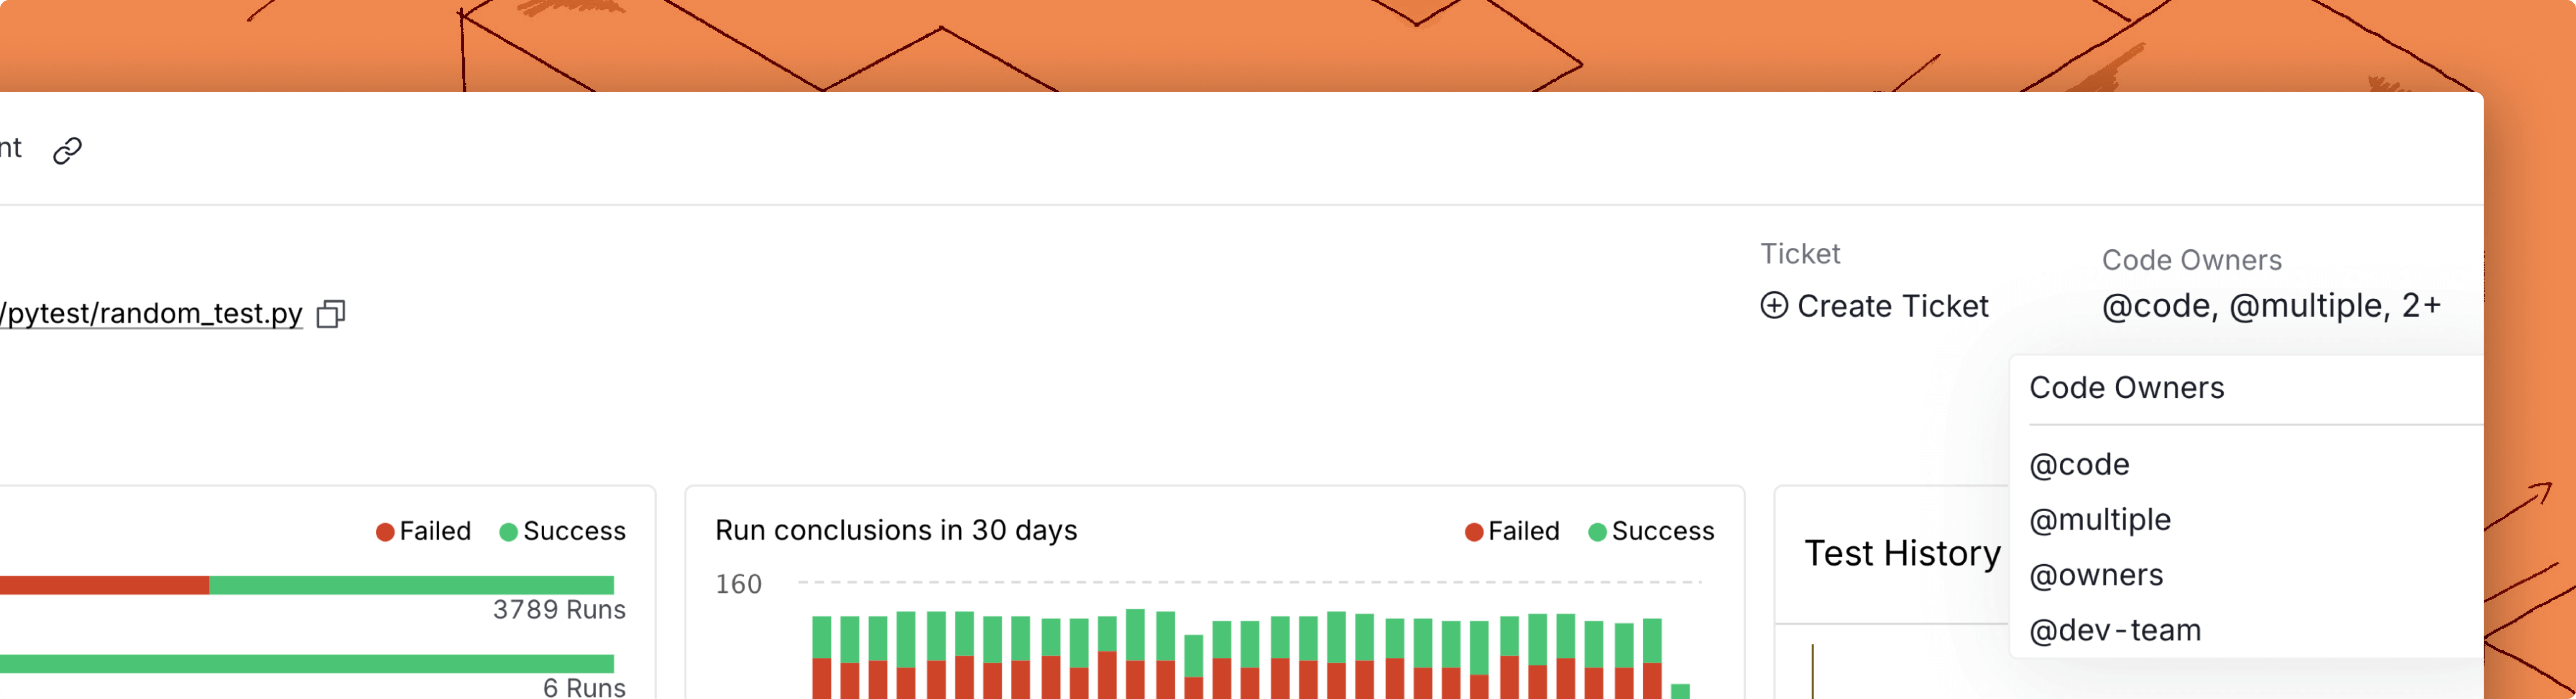
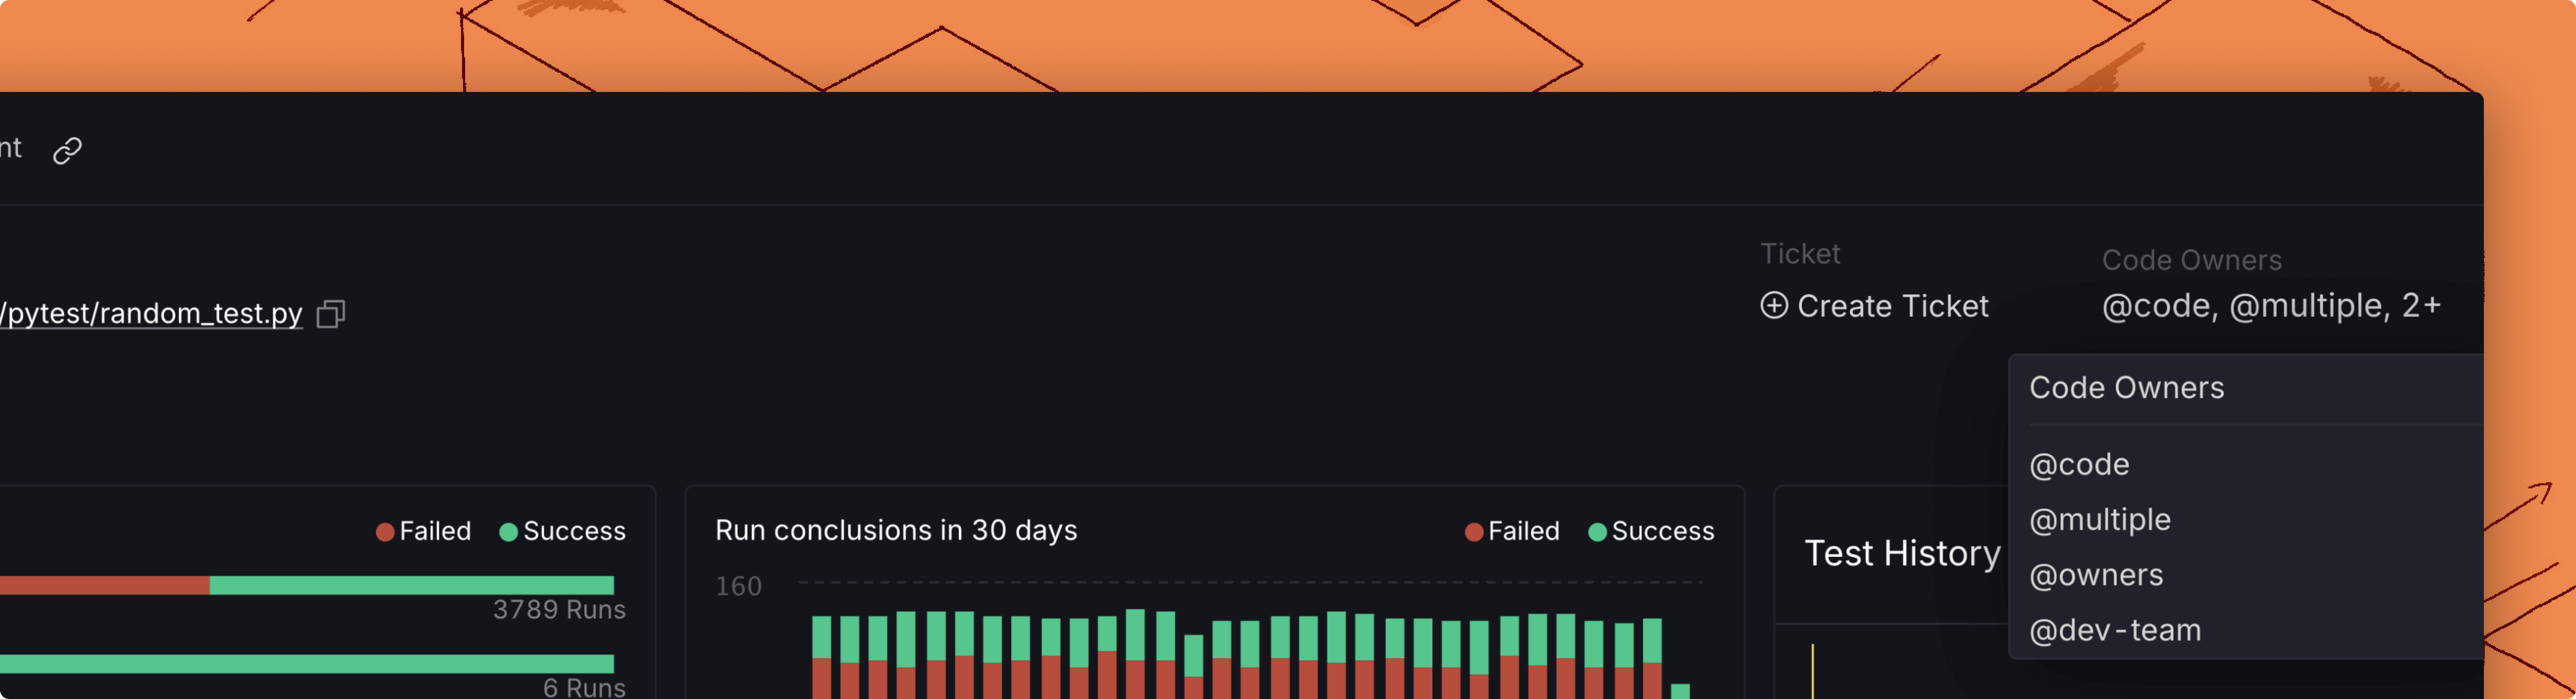
You can find the code owners of each test on the top right of the test details screen.
Summary tab
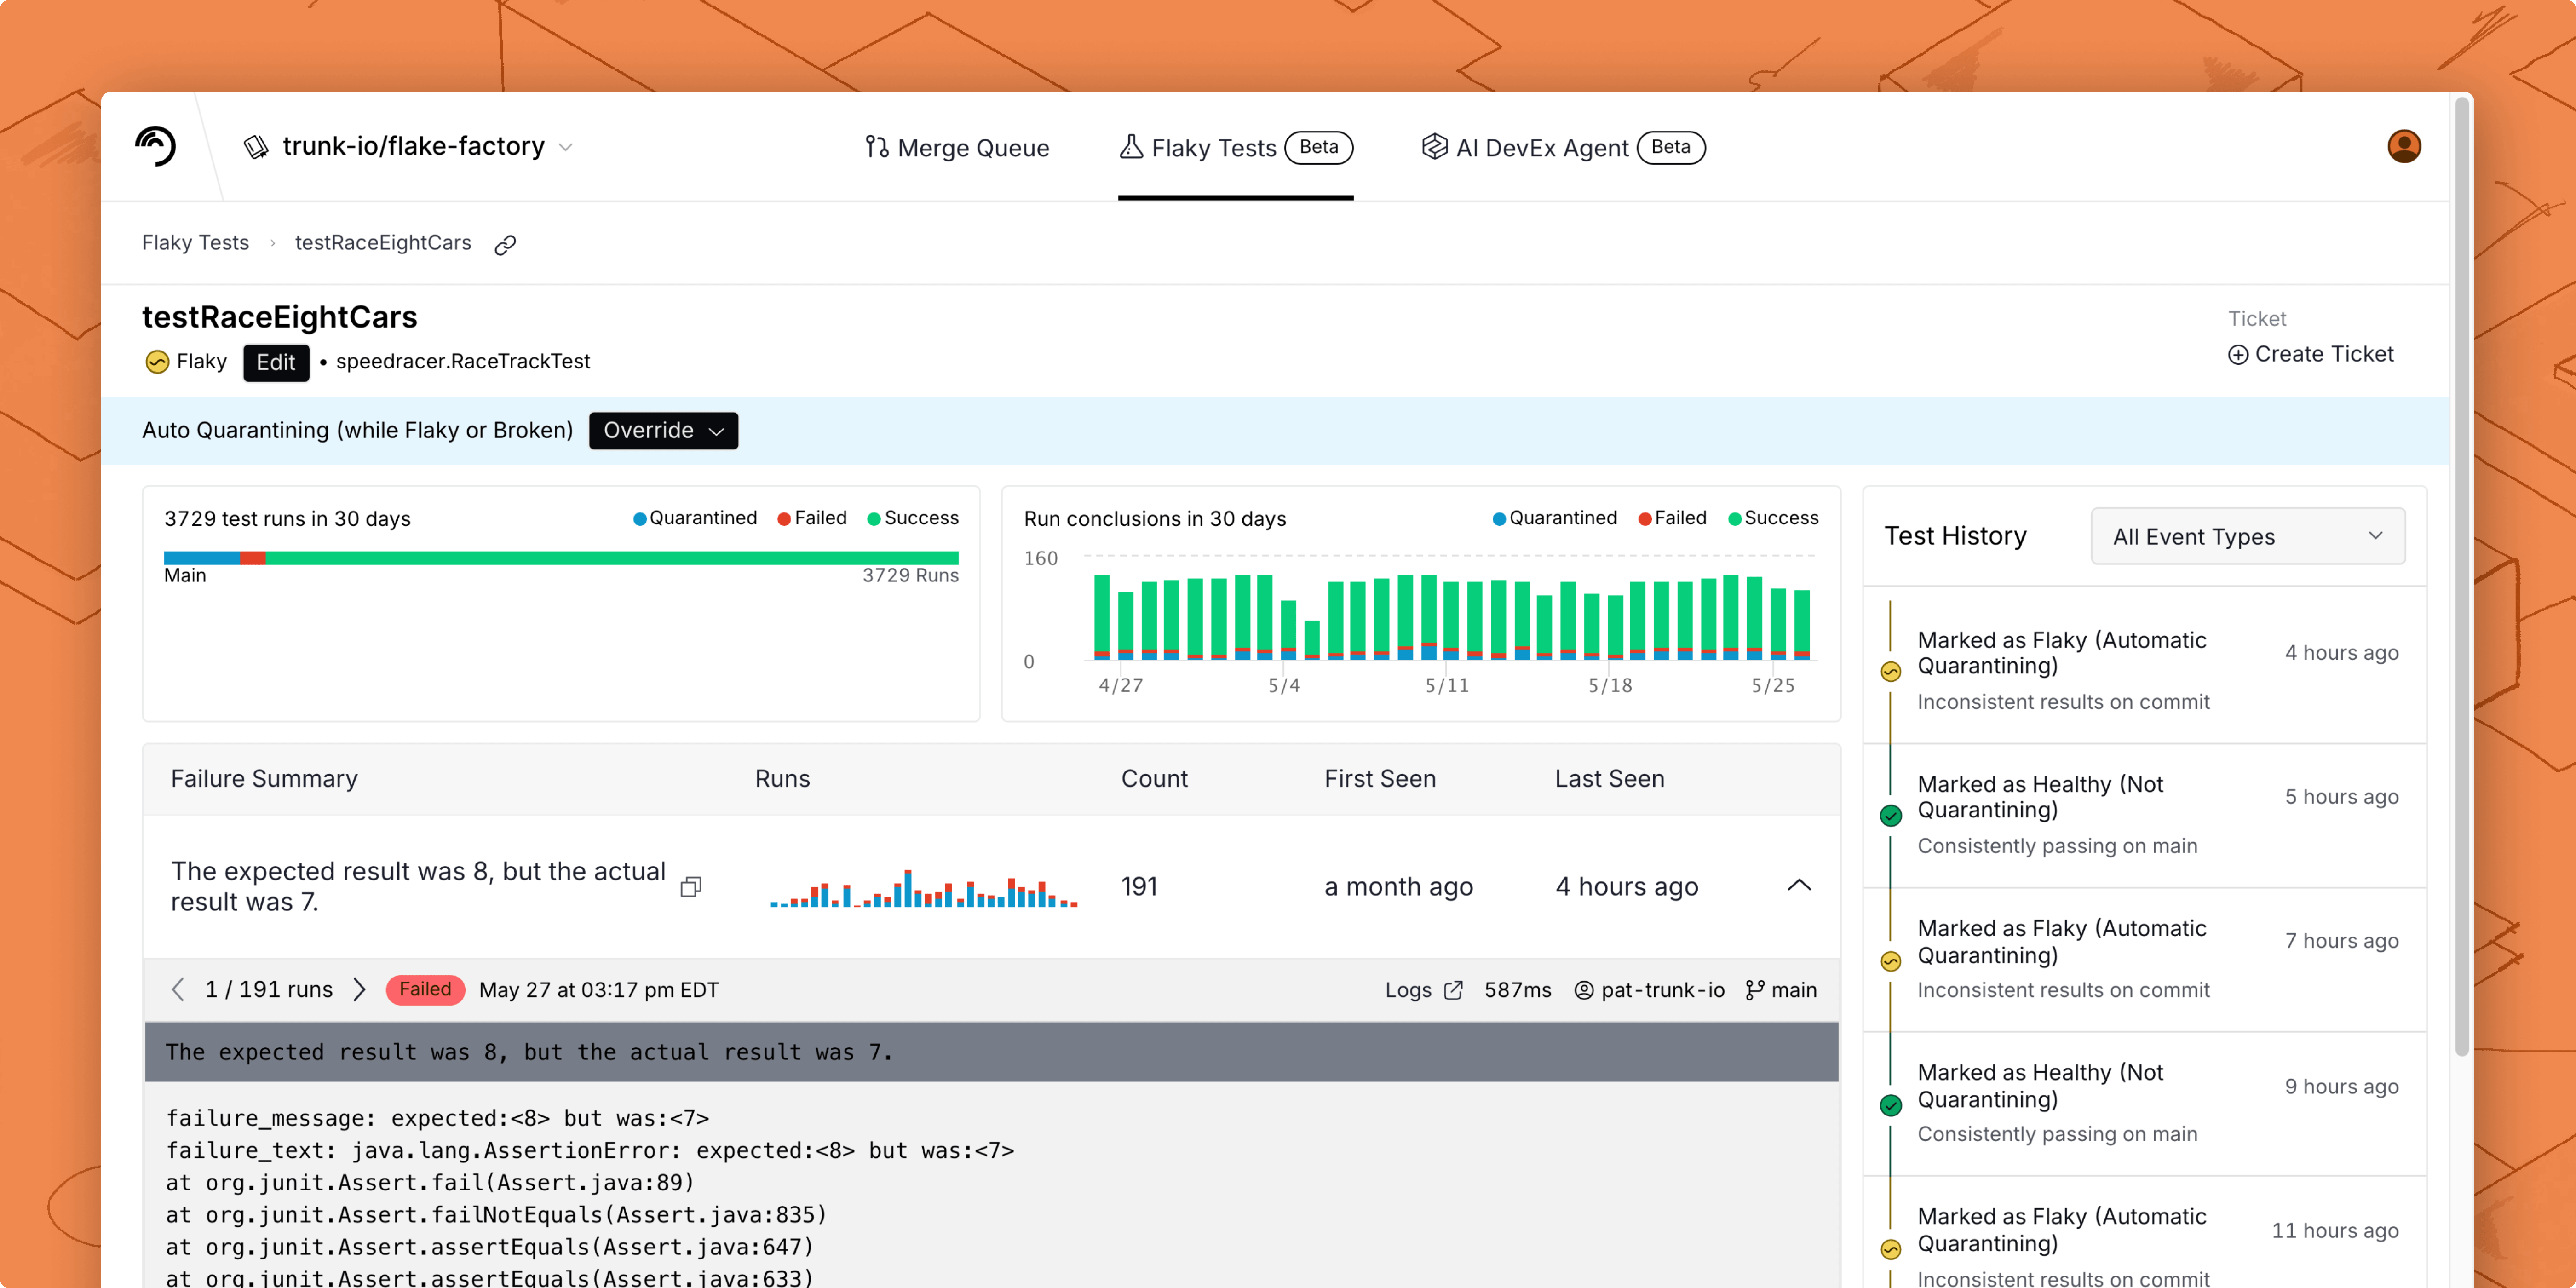
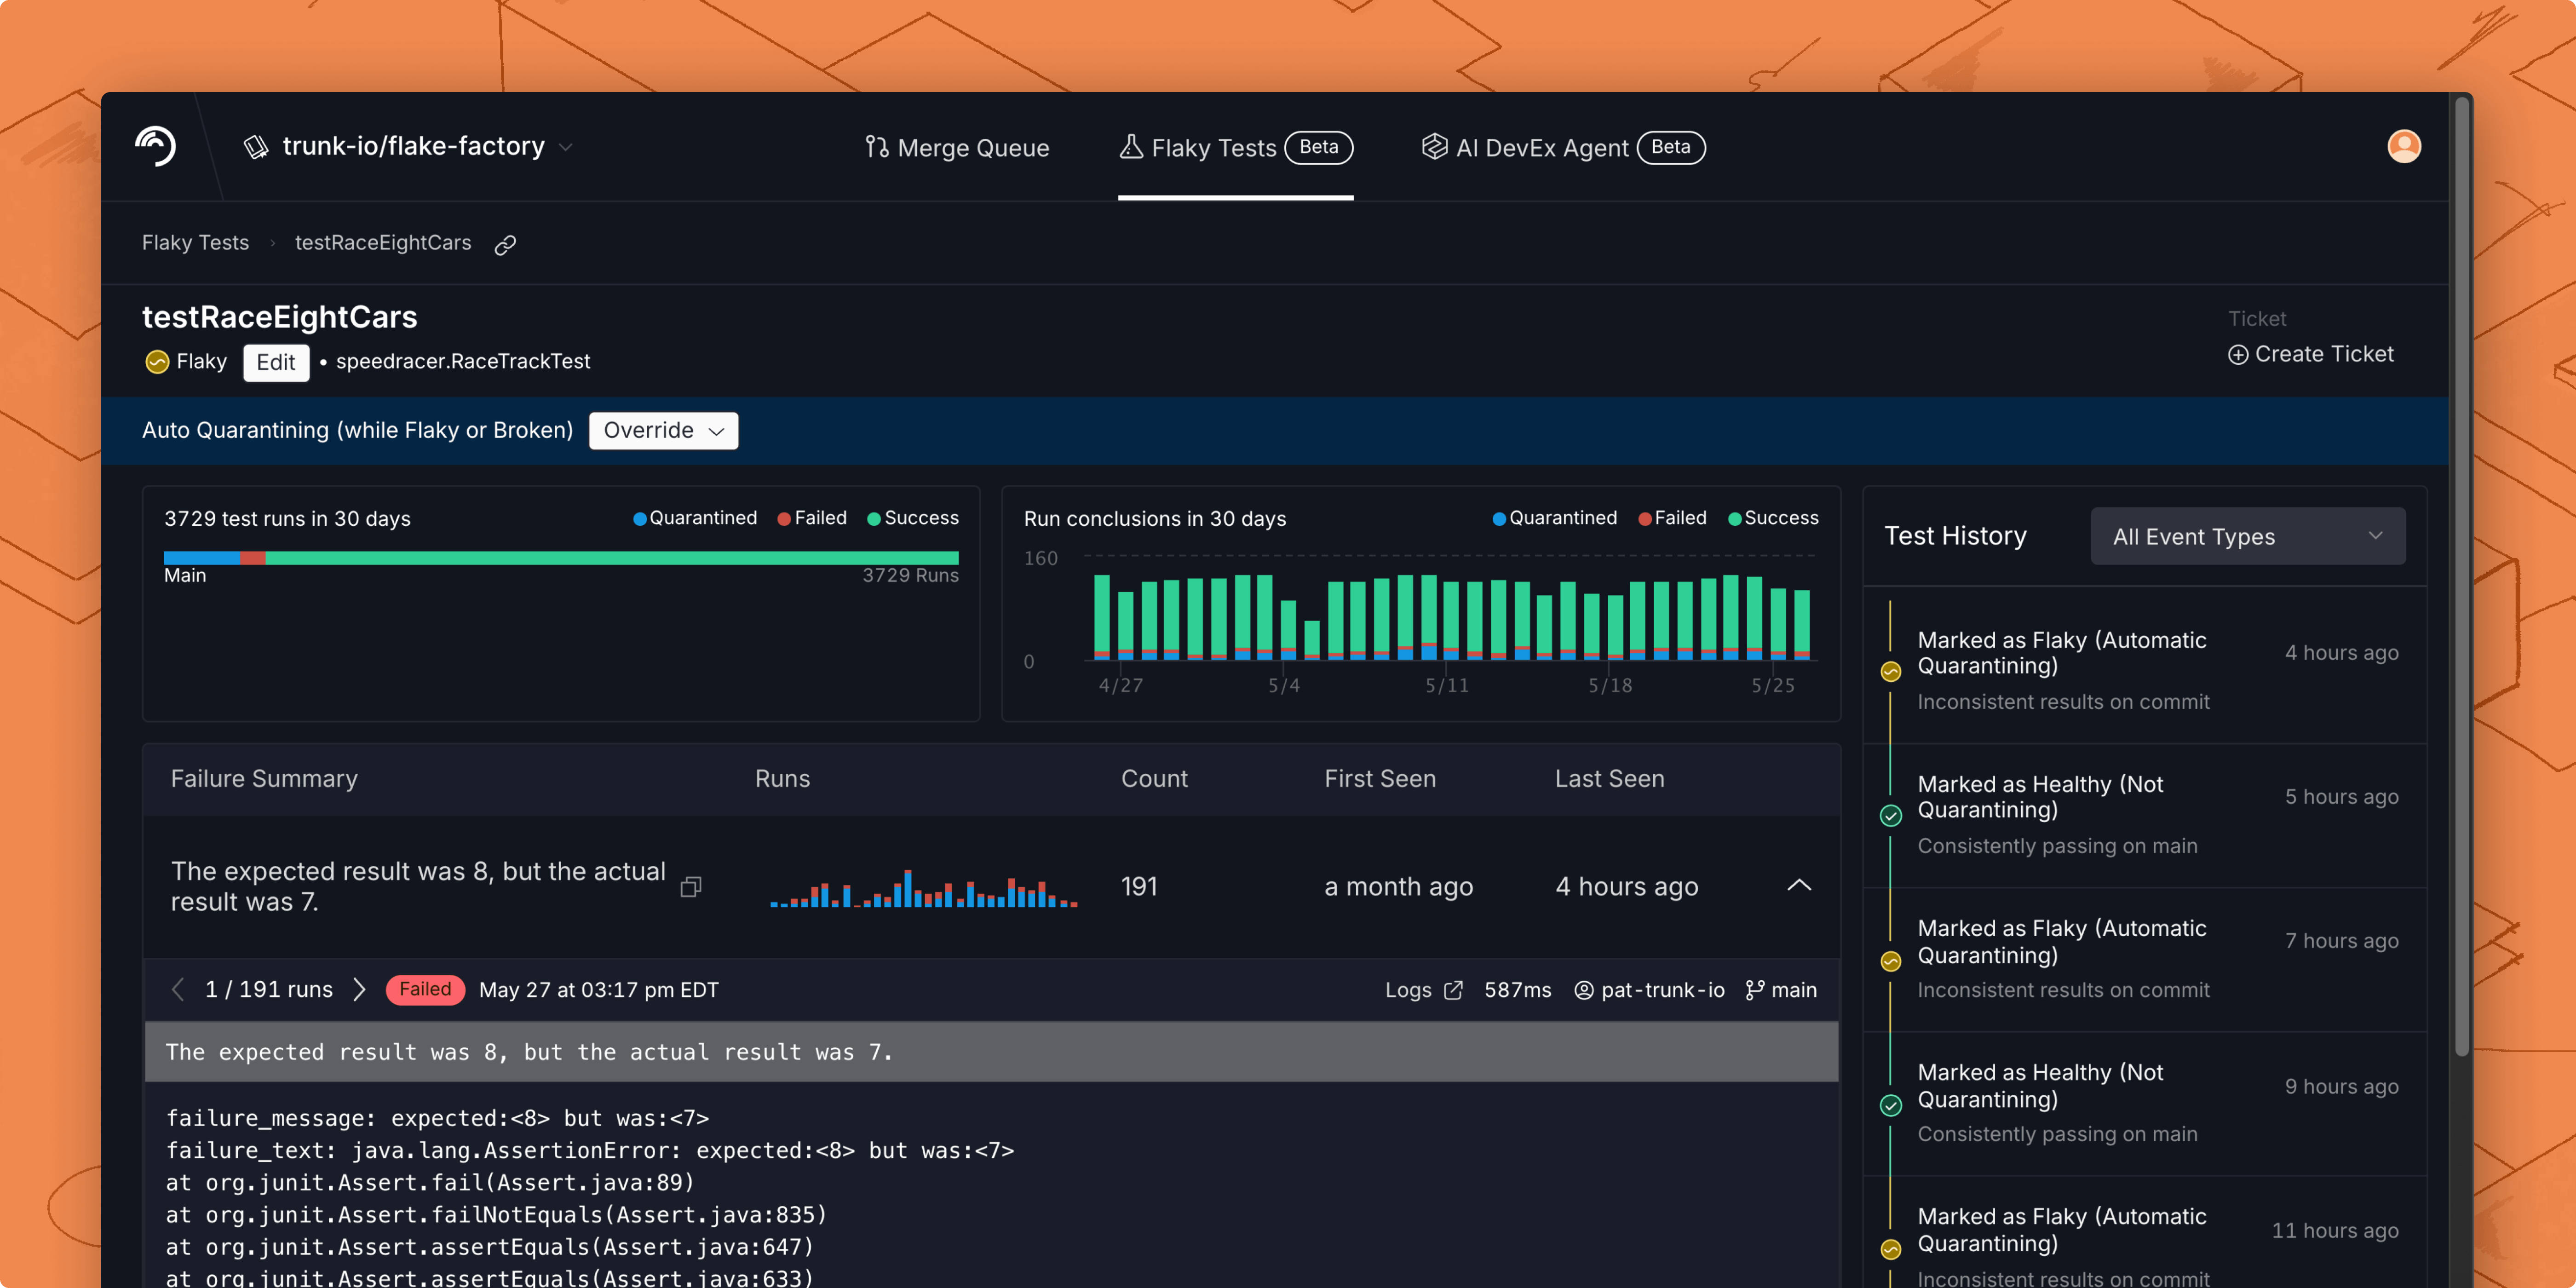
Failure types
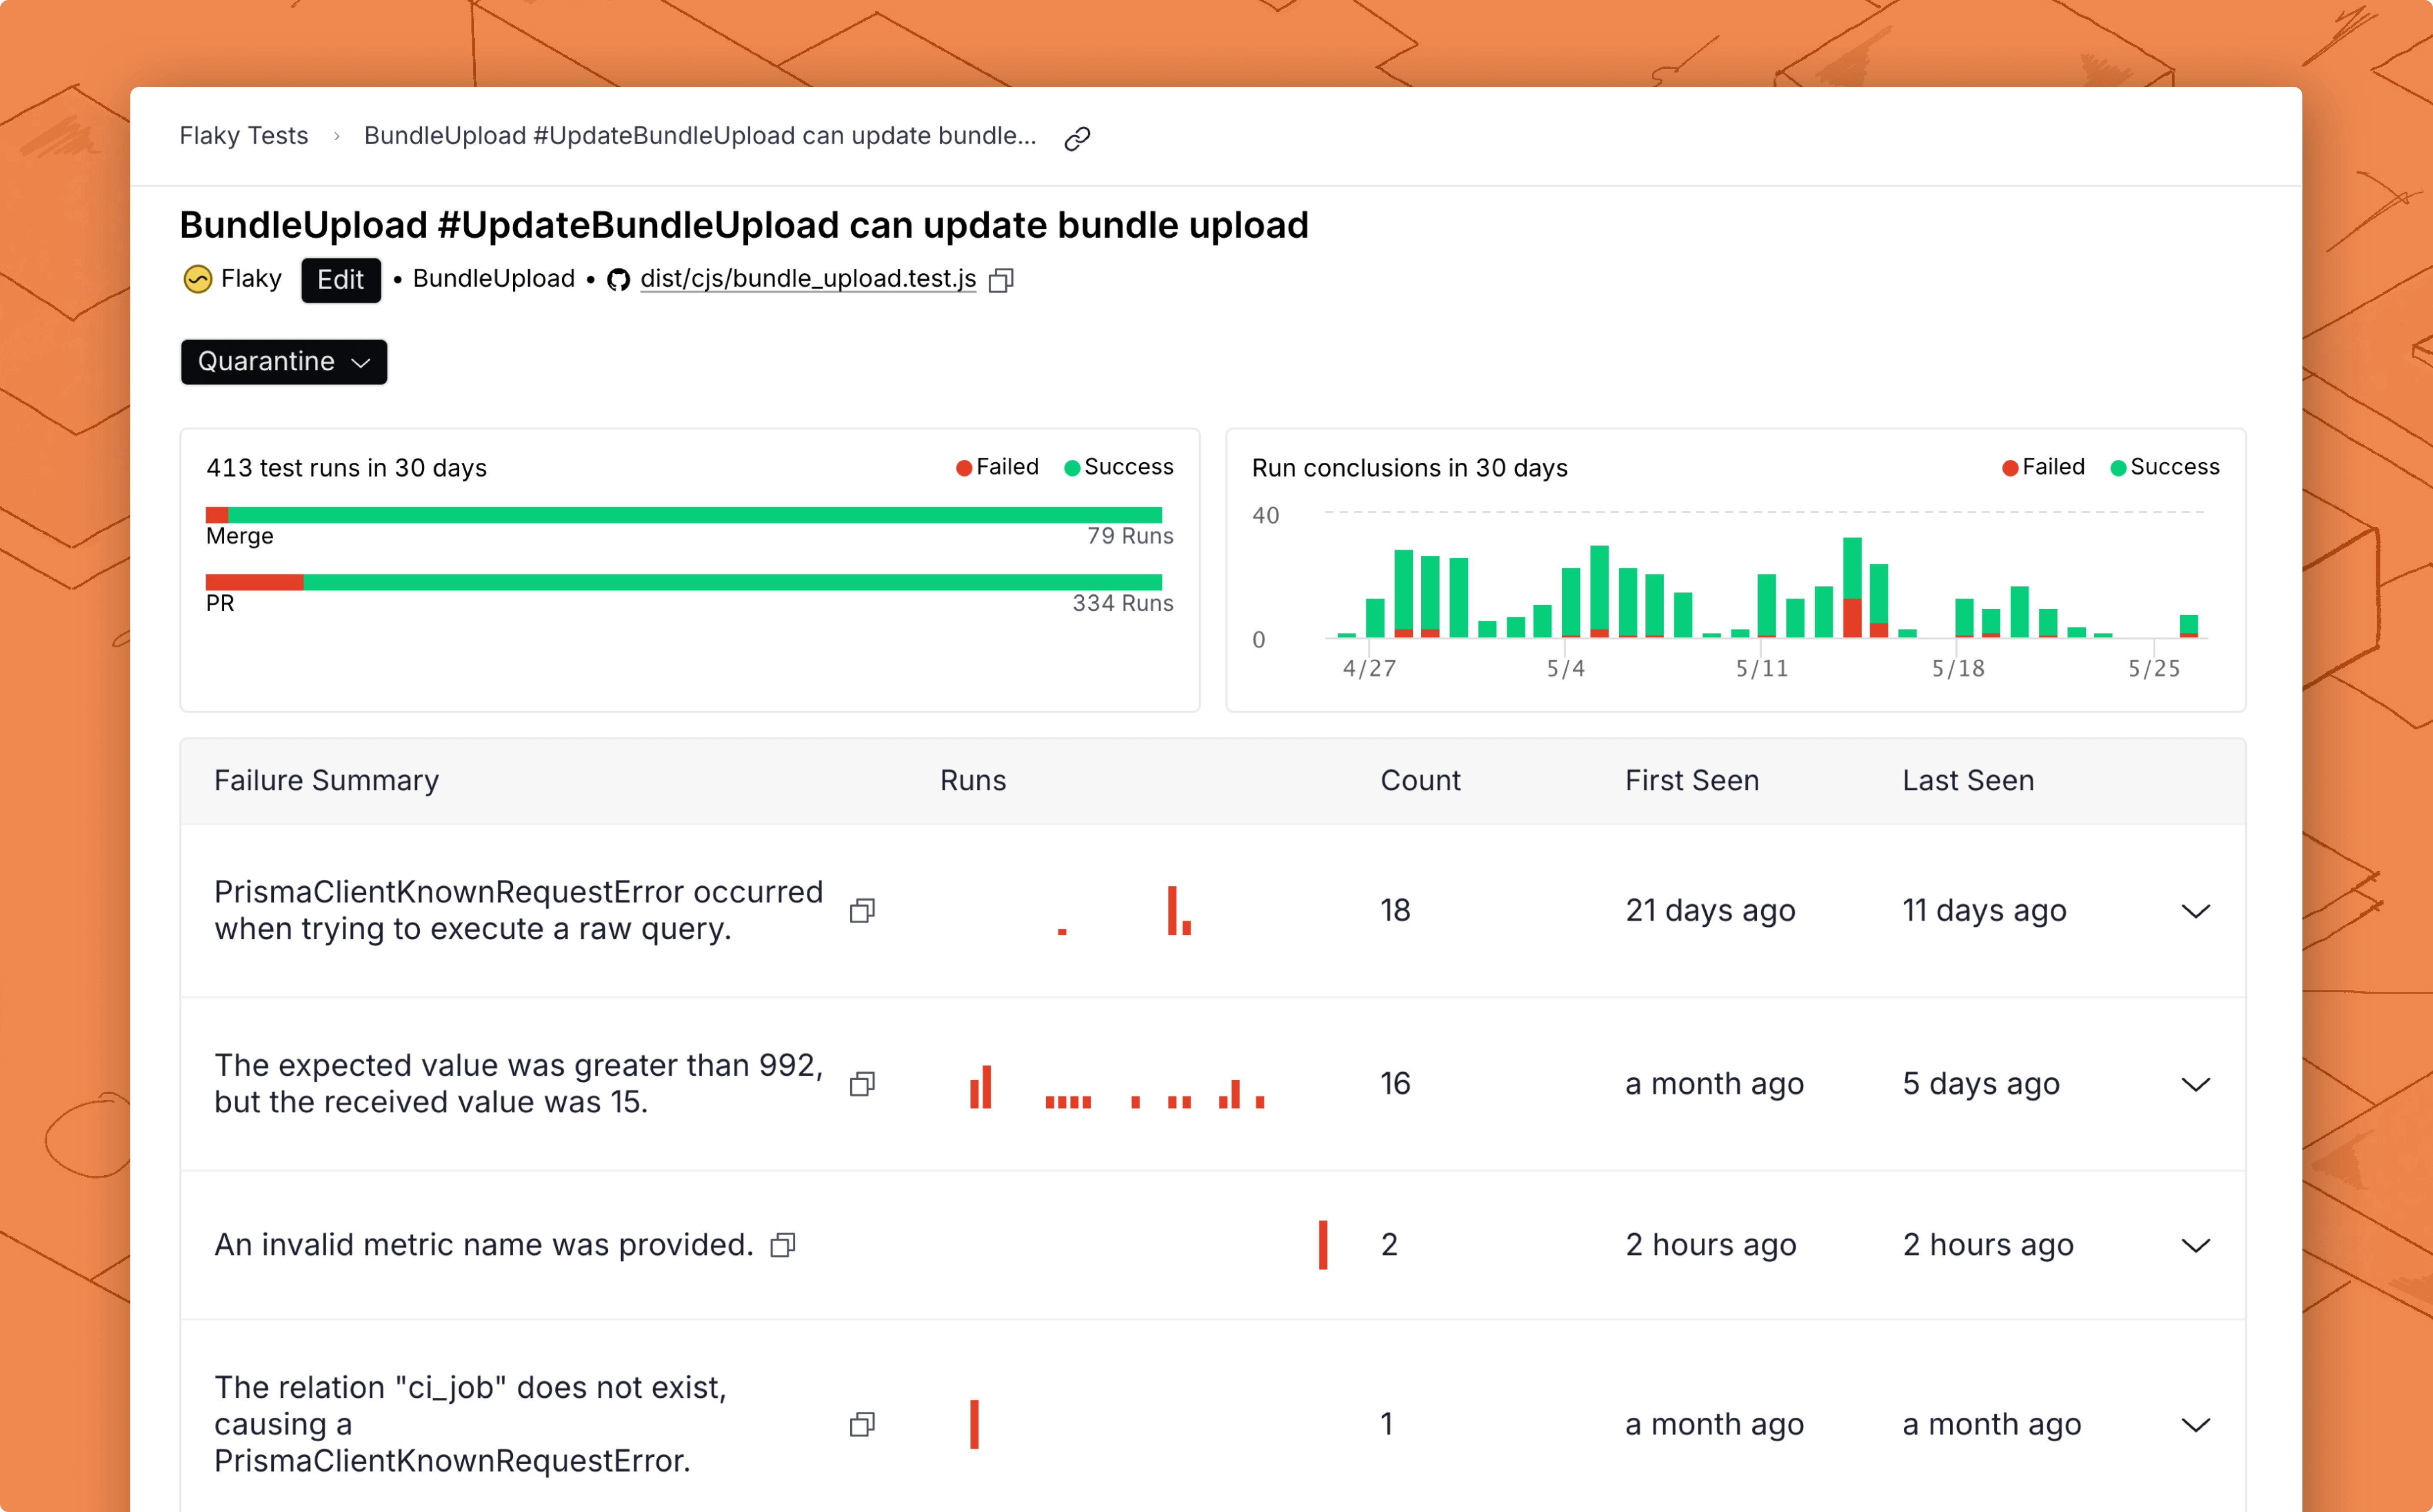
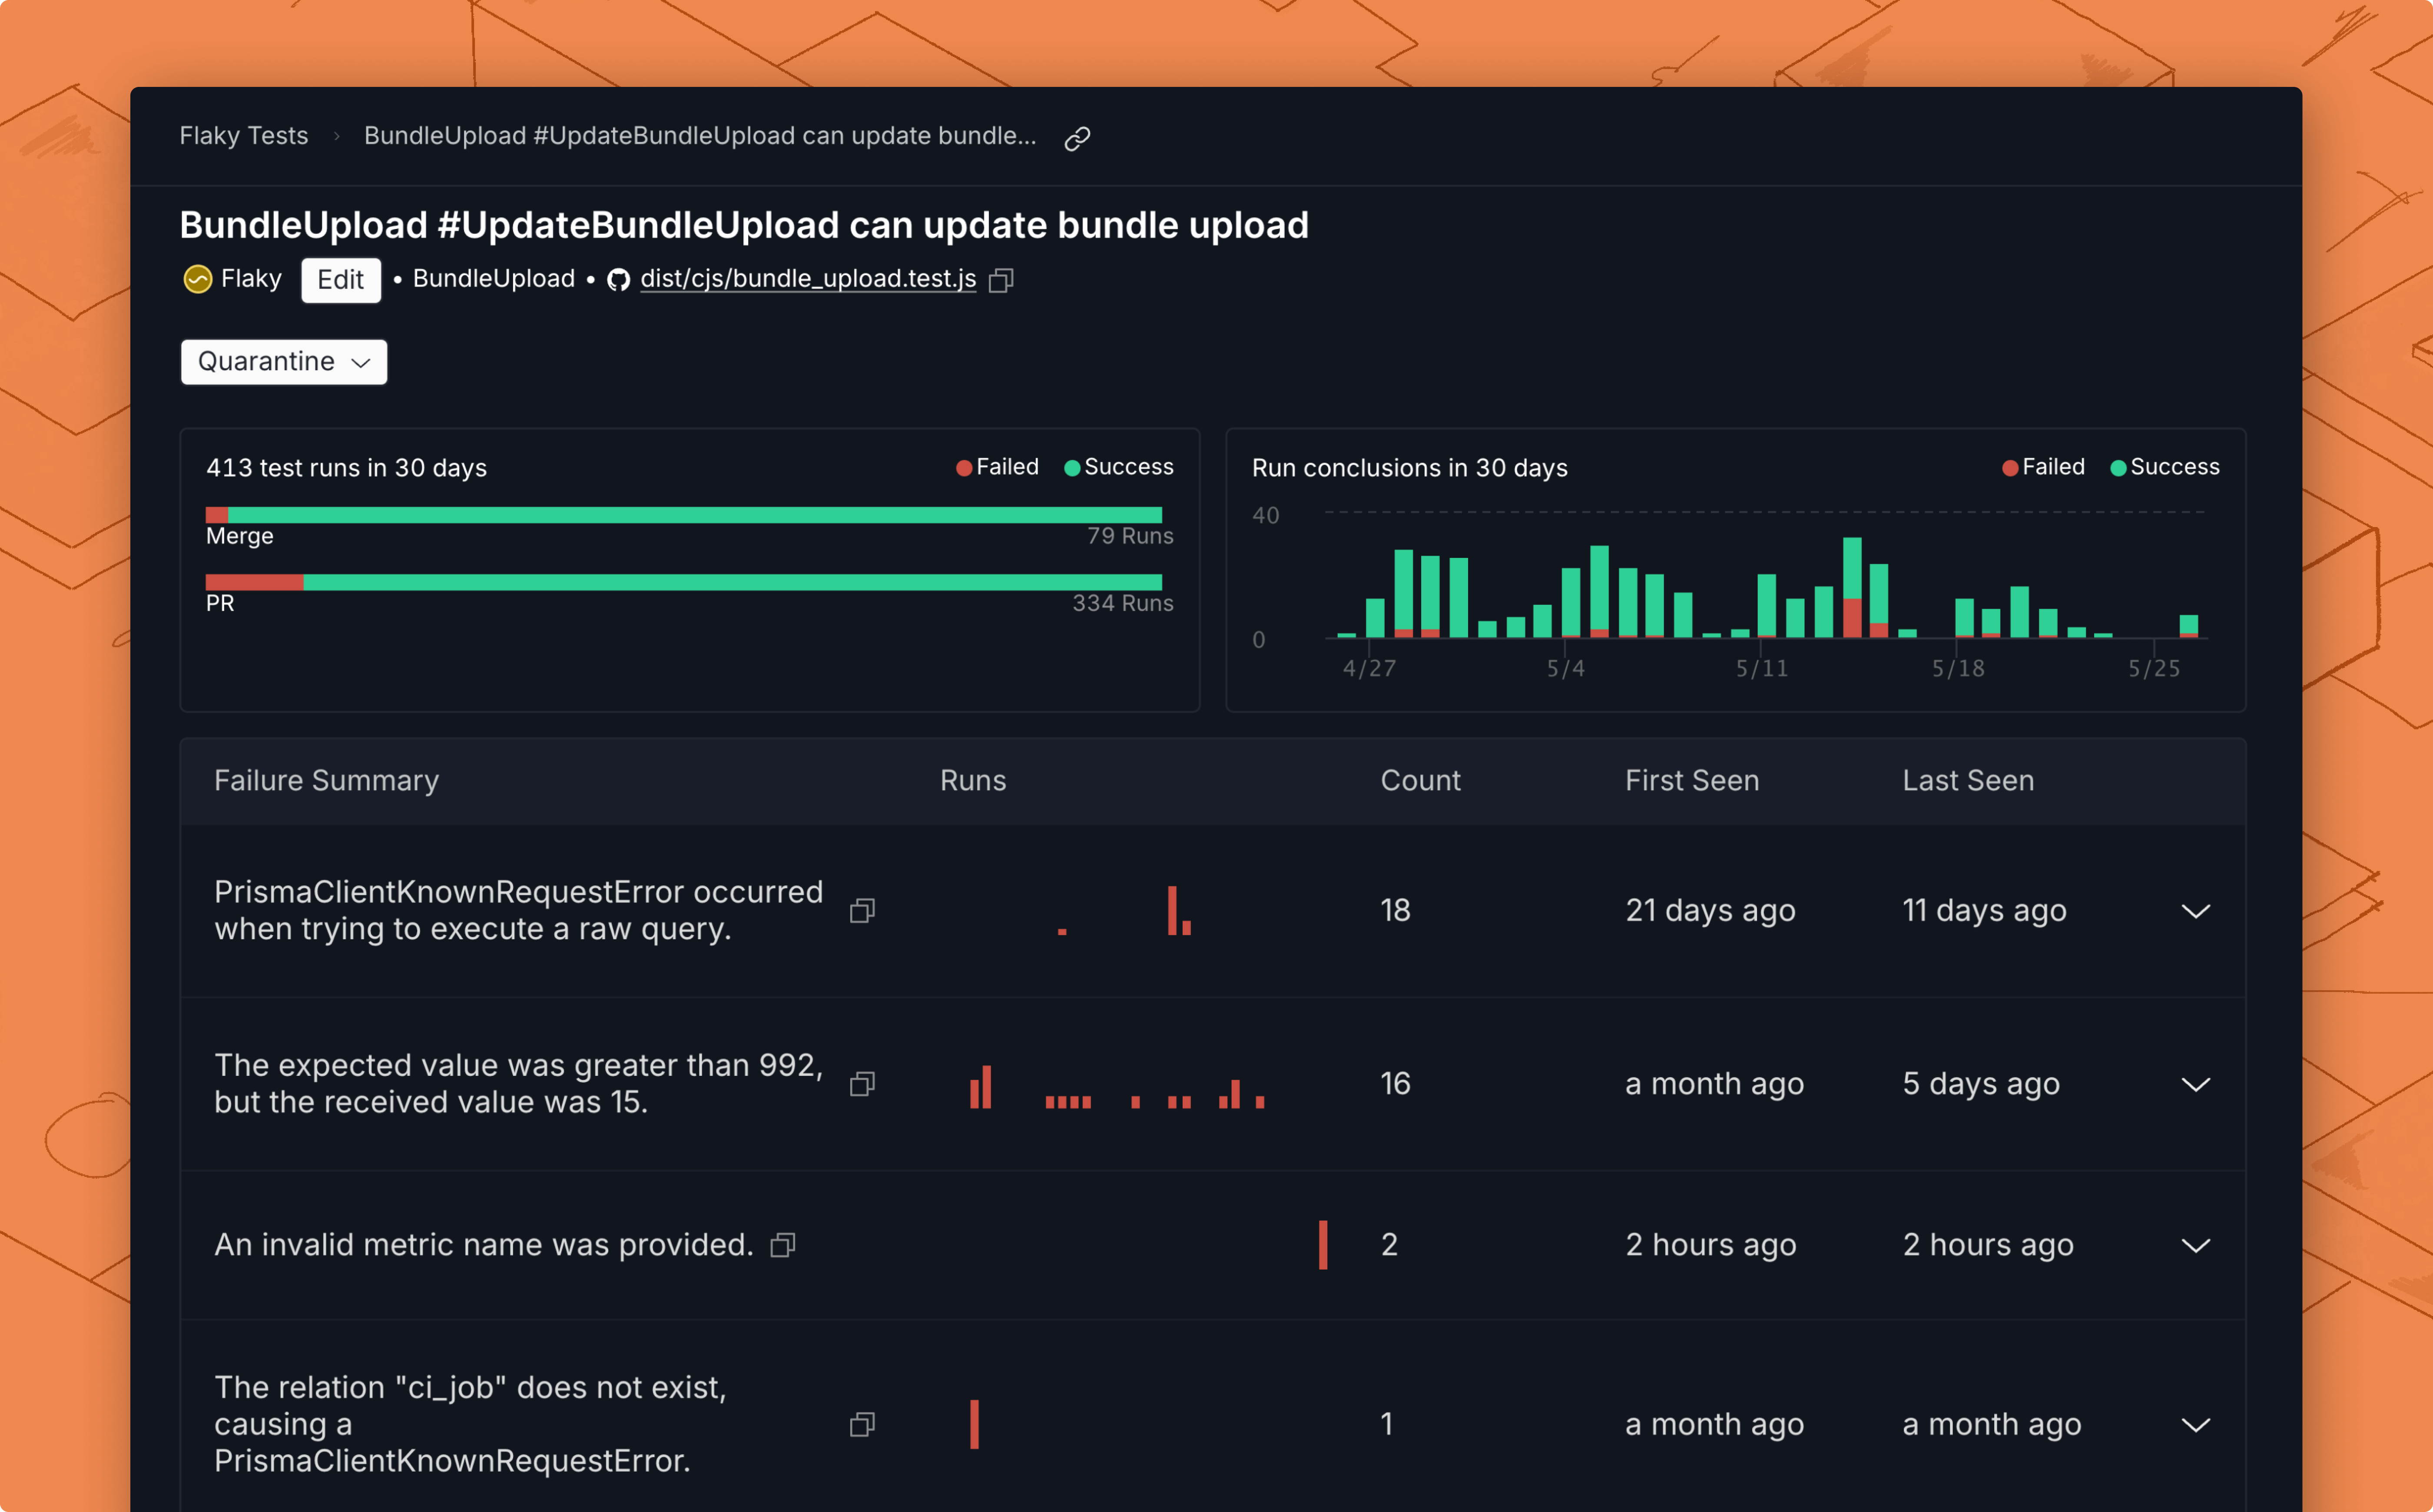
Failure details
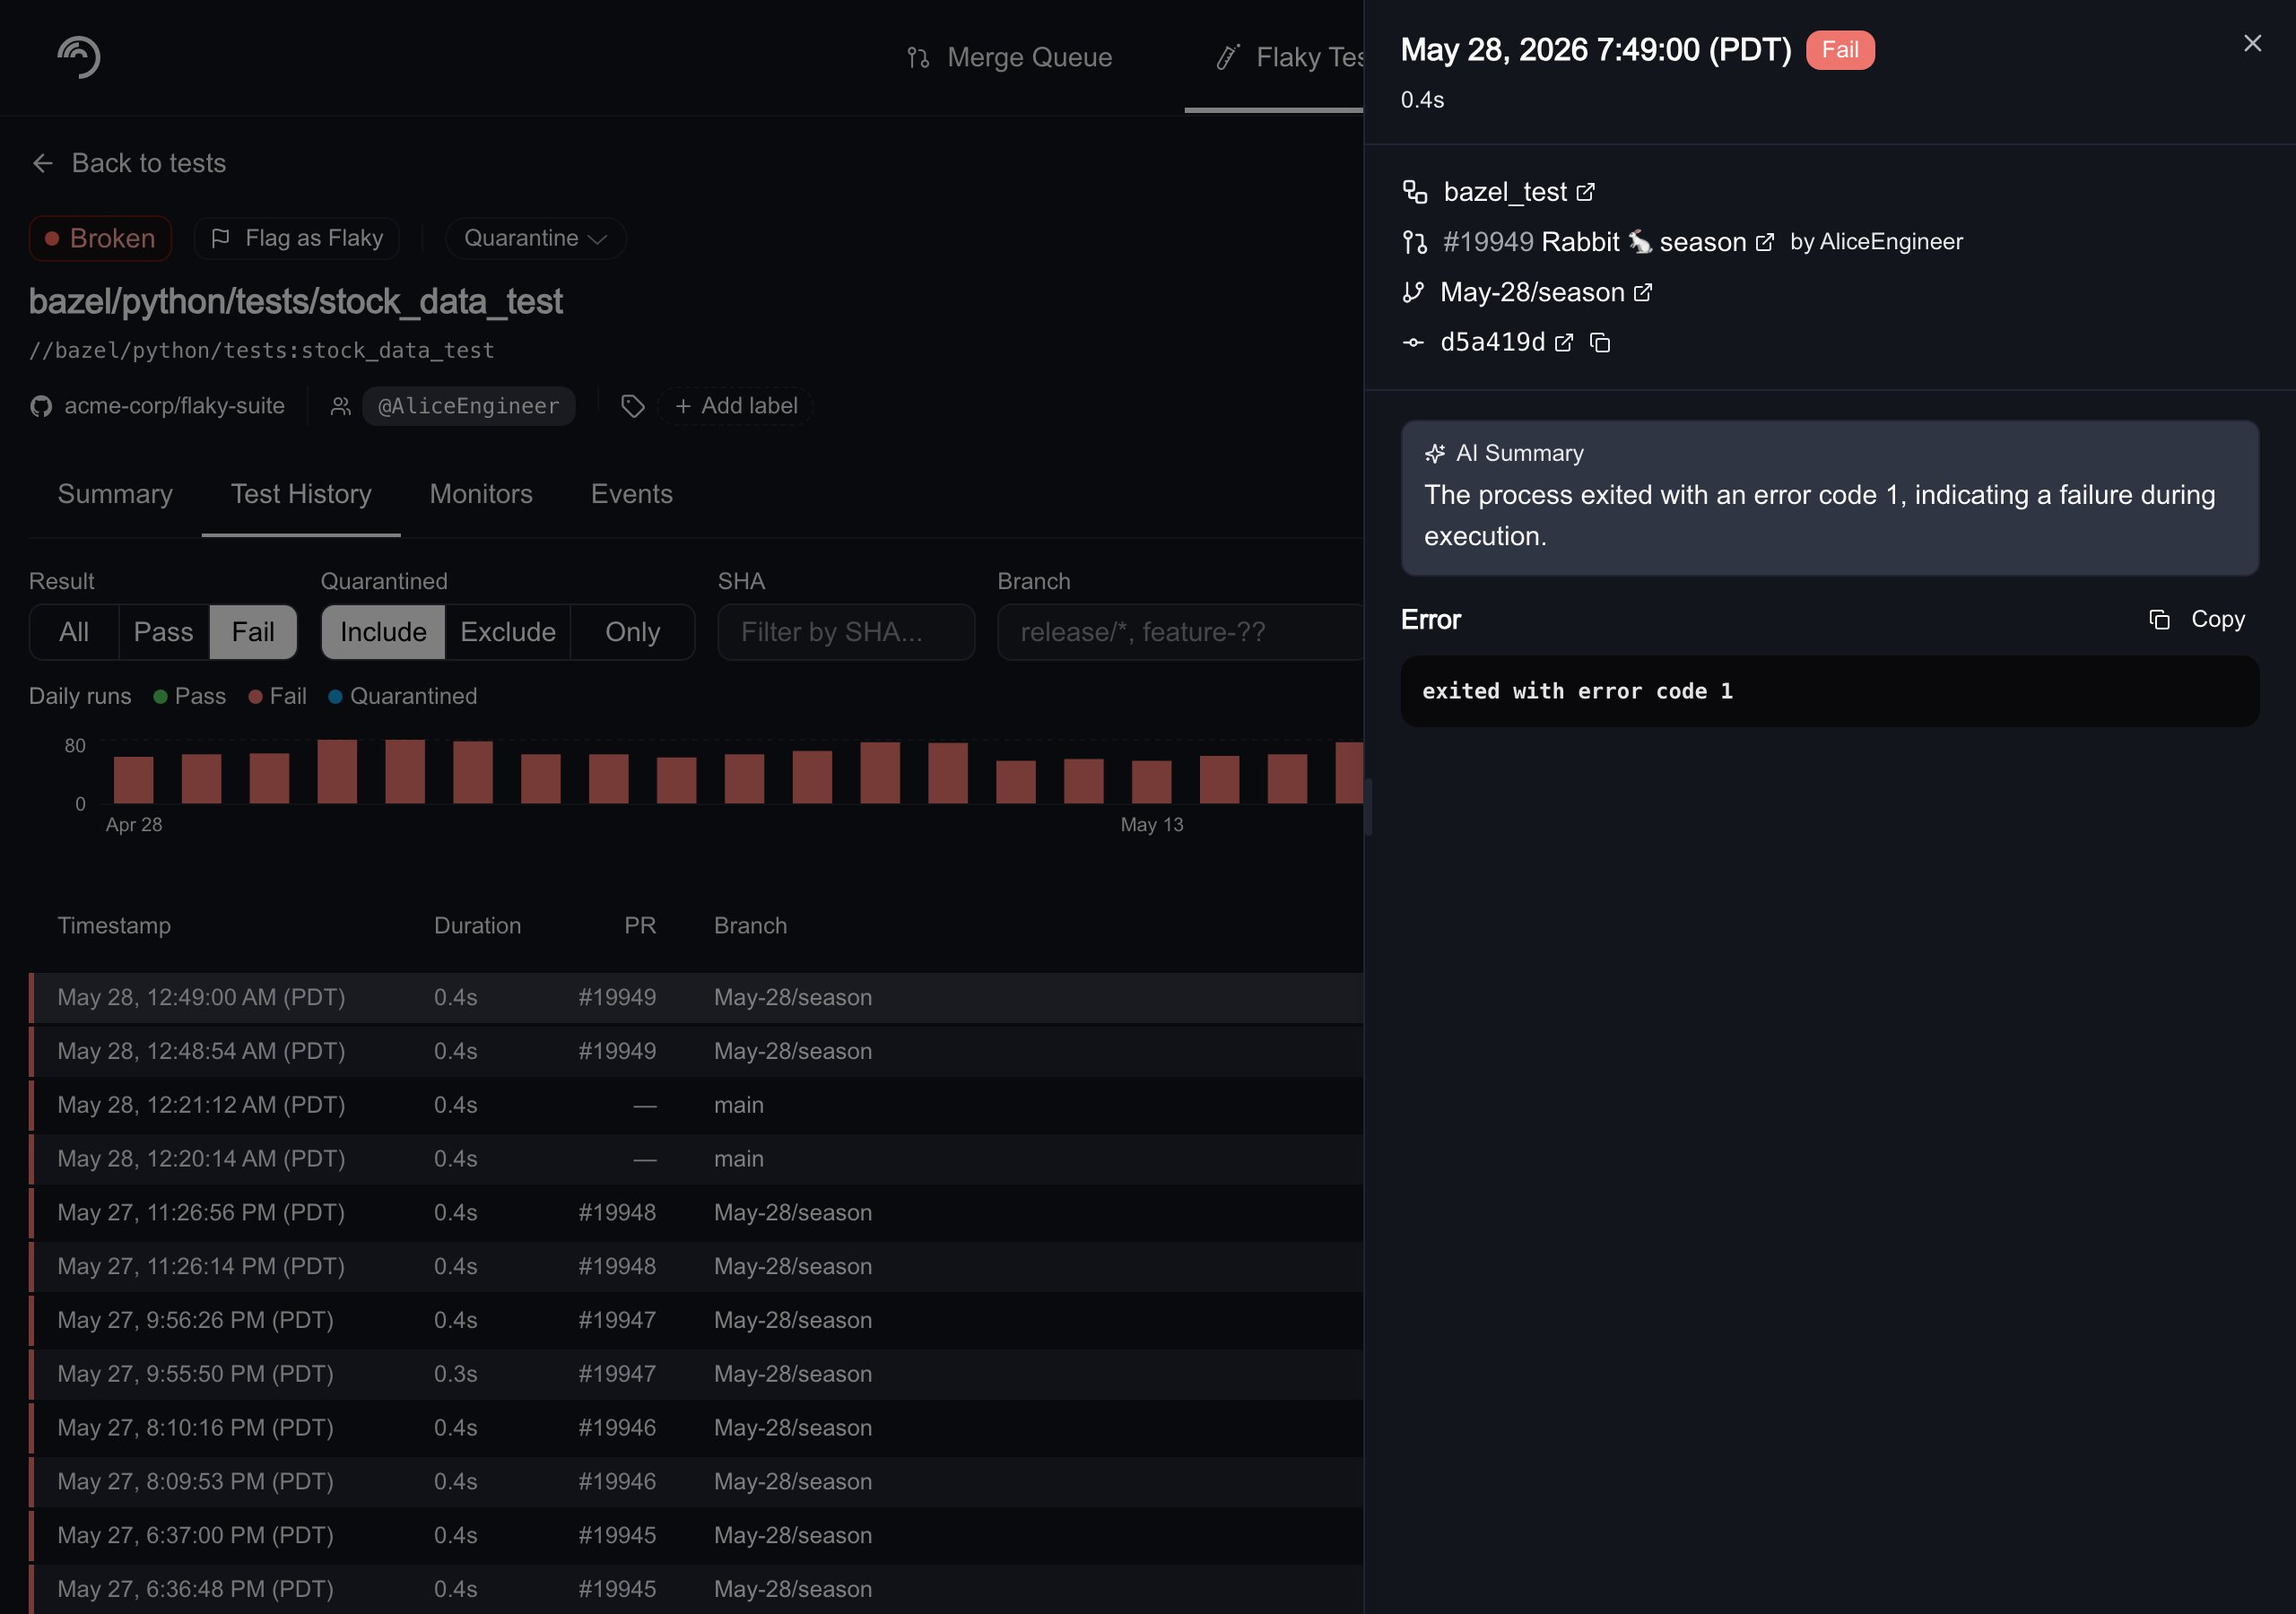
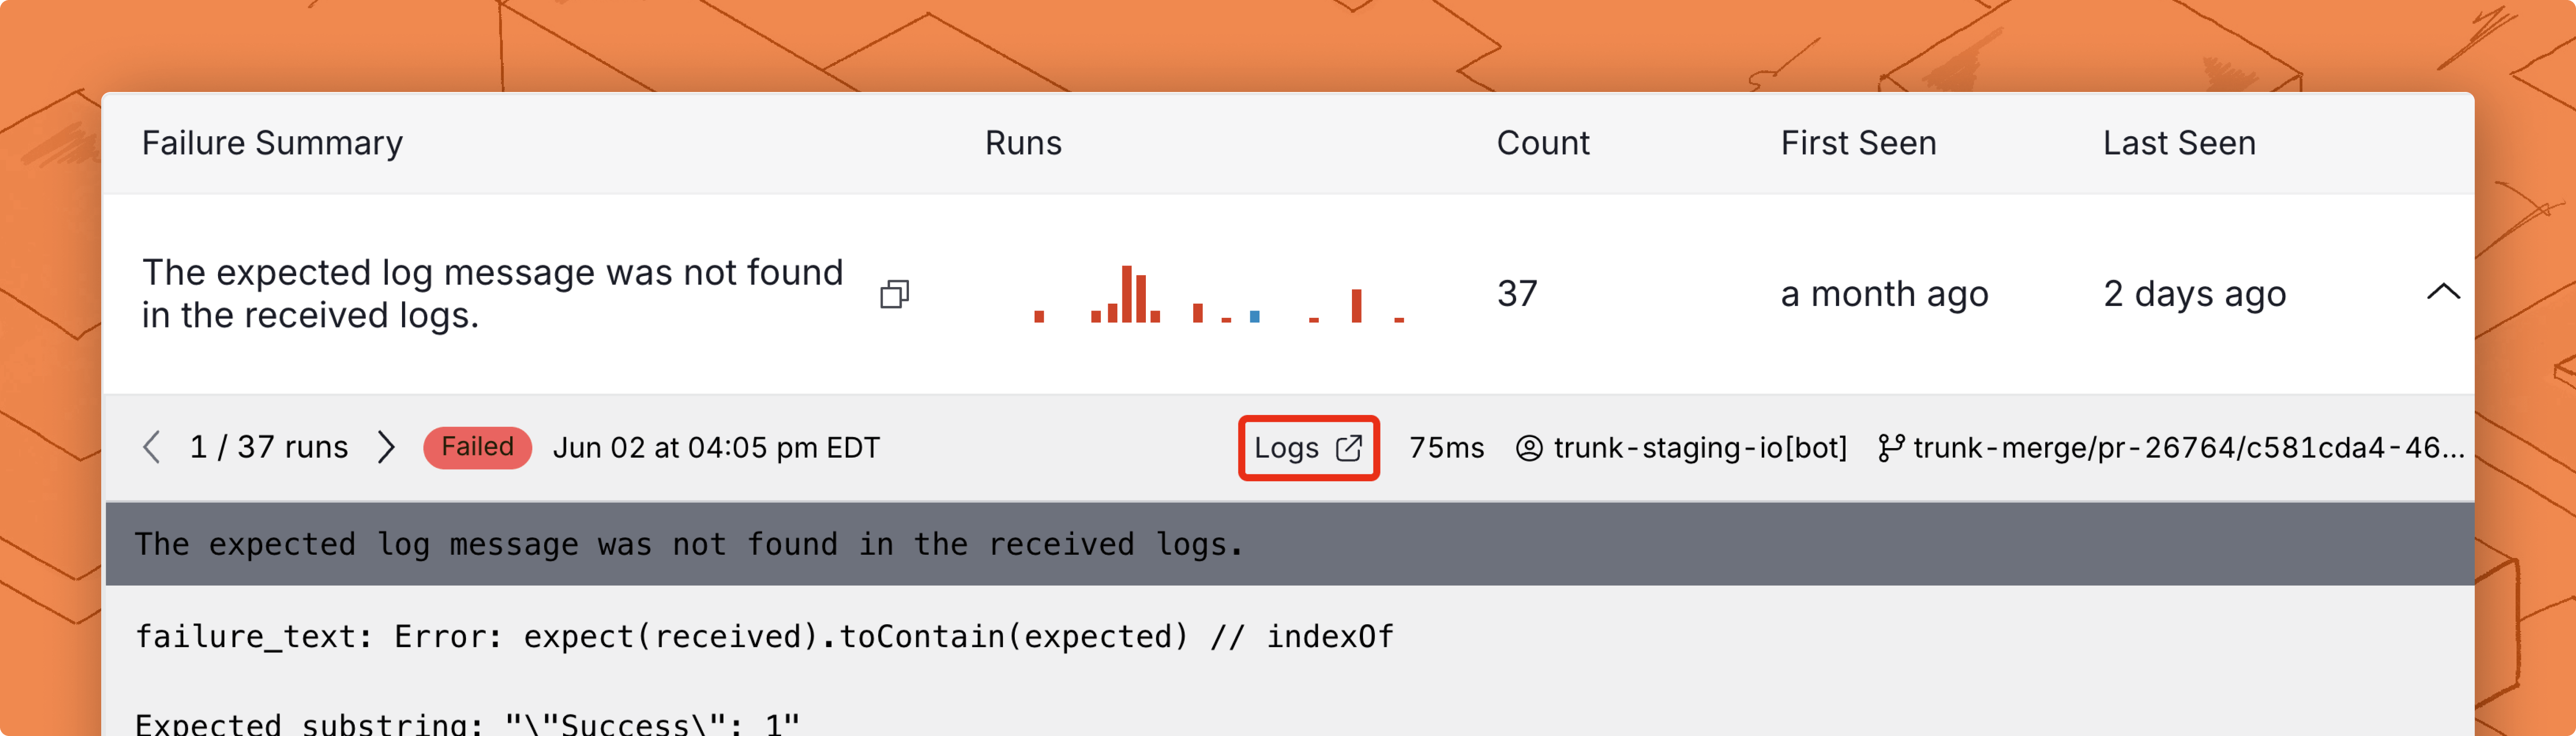
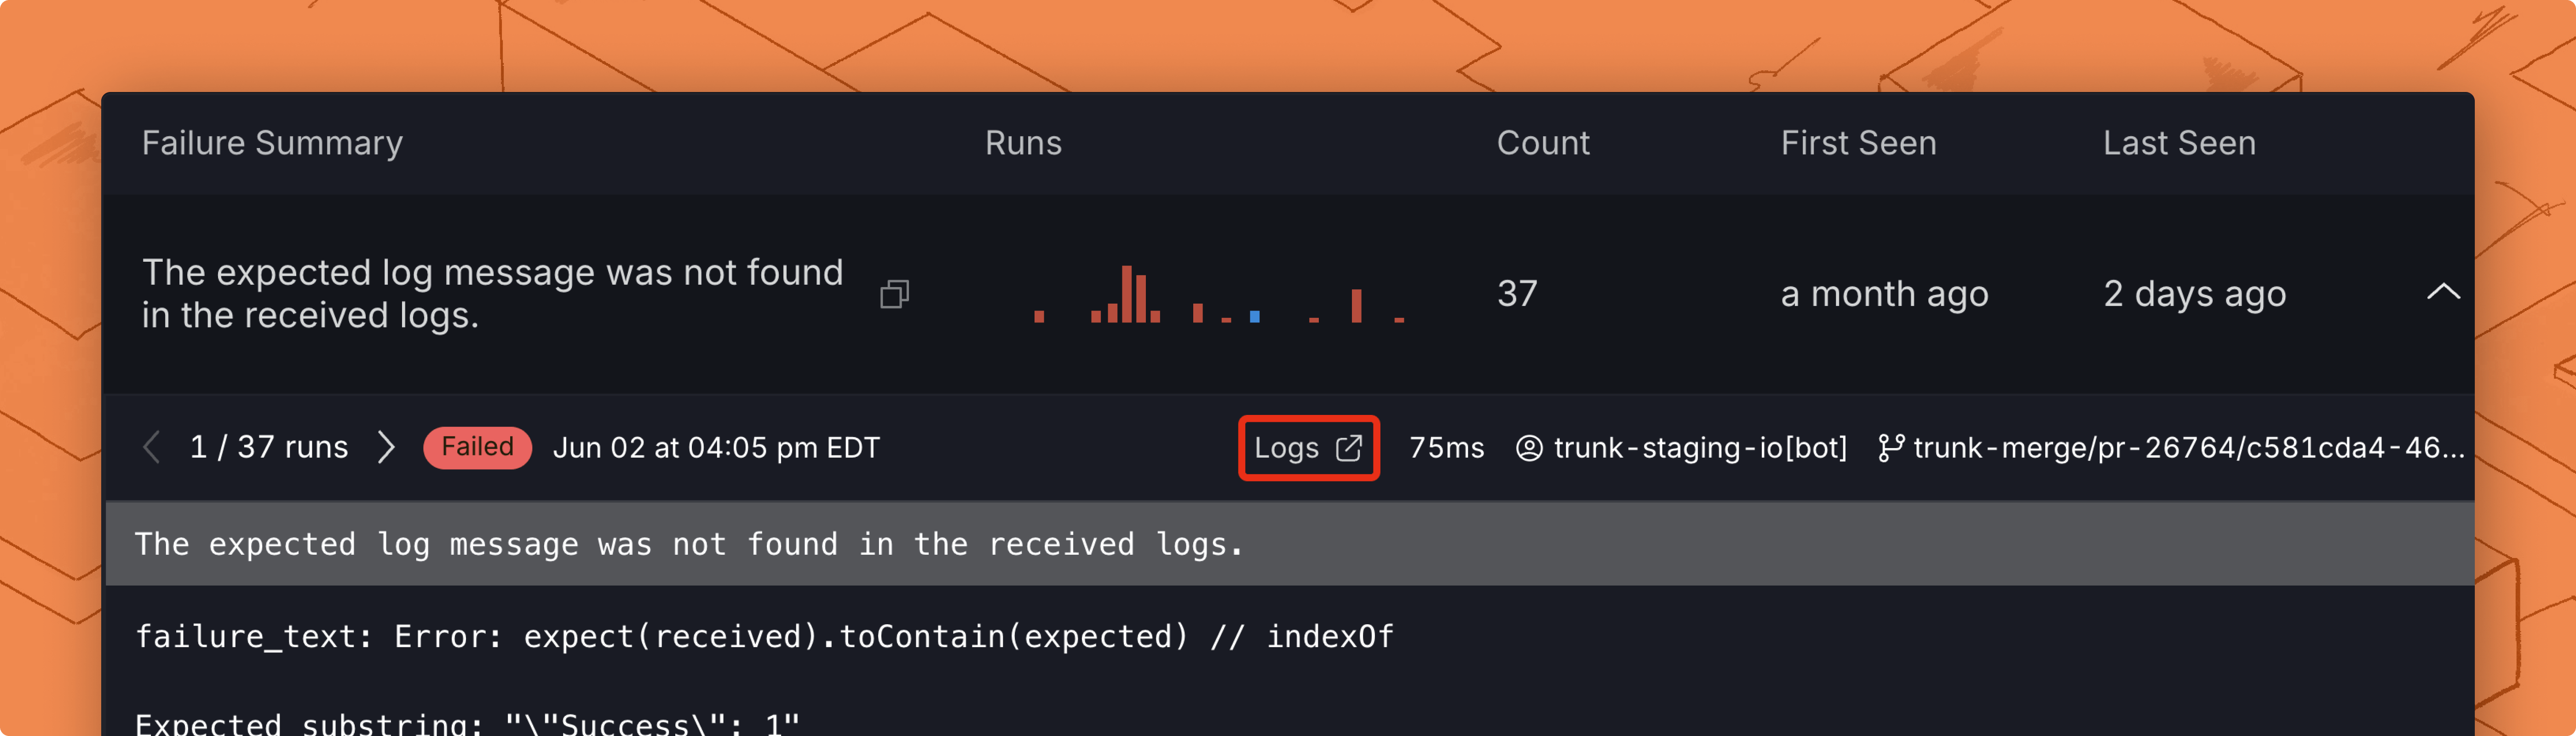
You can click on any of these test runs to see the detailed stack trace: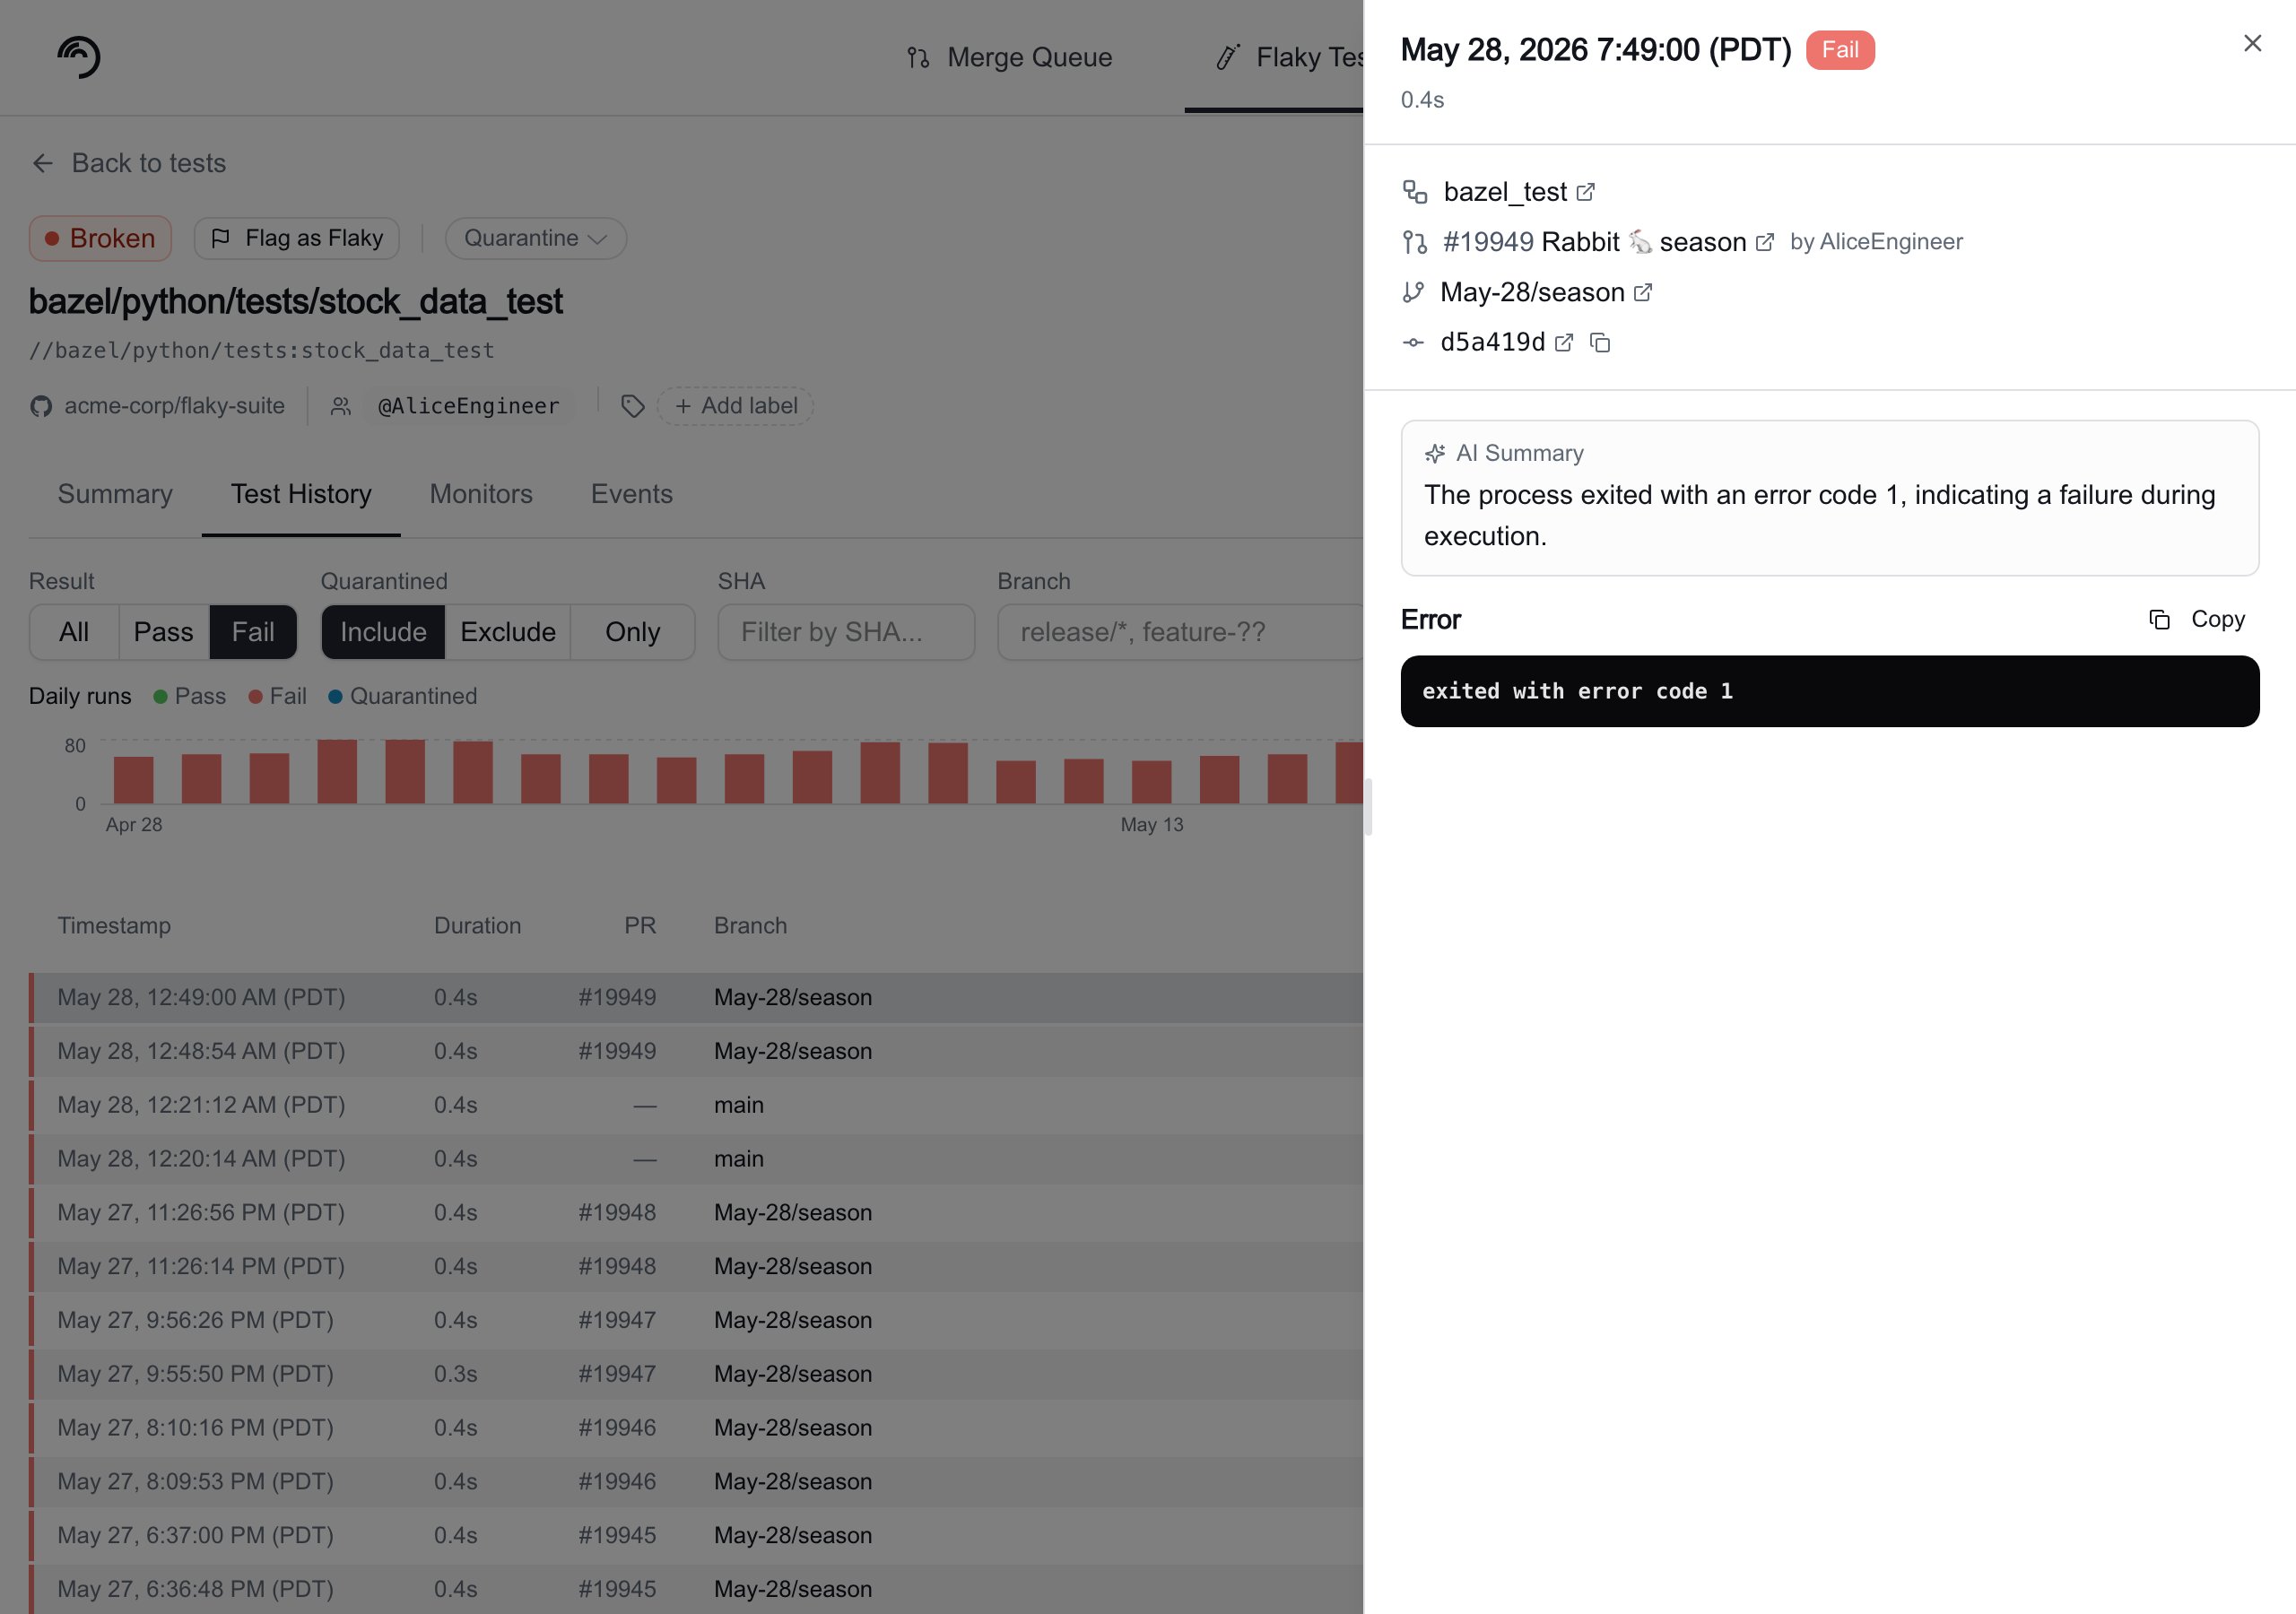
Test History tab
The Test History tab gives you full visibility into every individual run of a test. Use it to investigate patterns across branches, find specific failing runs, and drill into error details.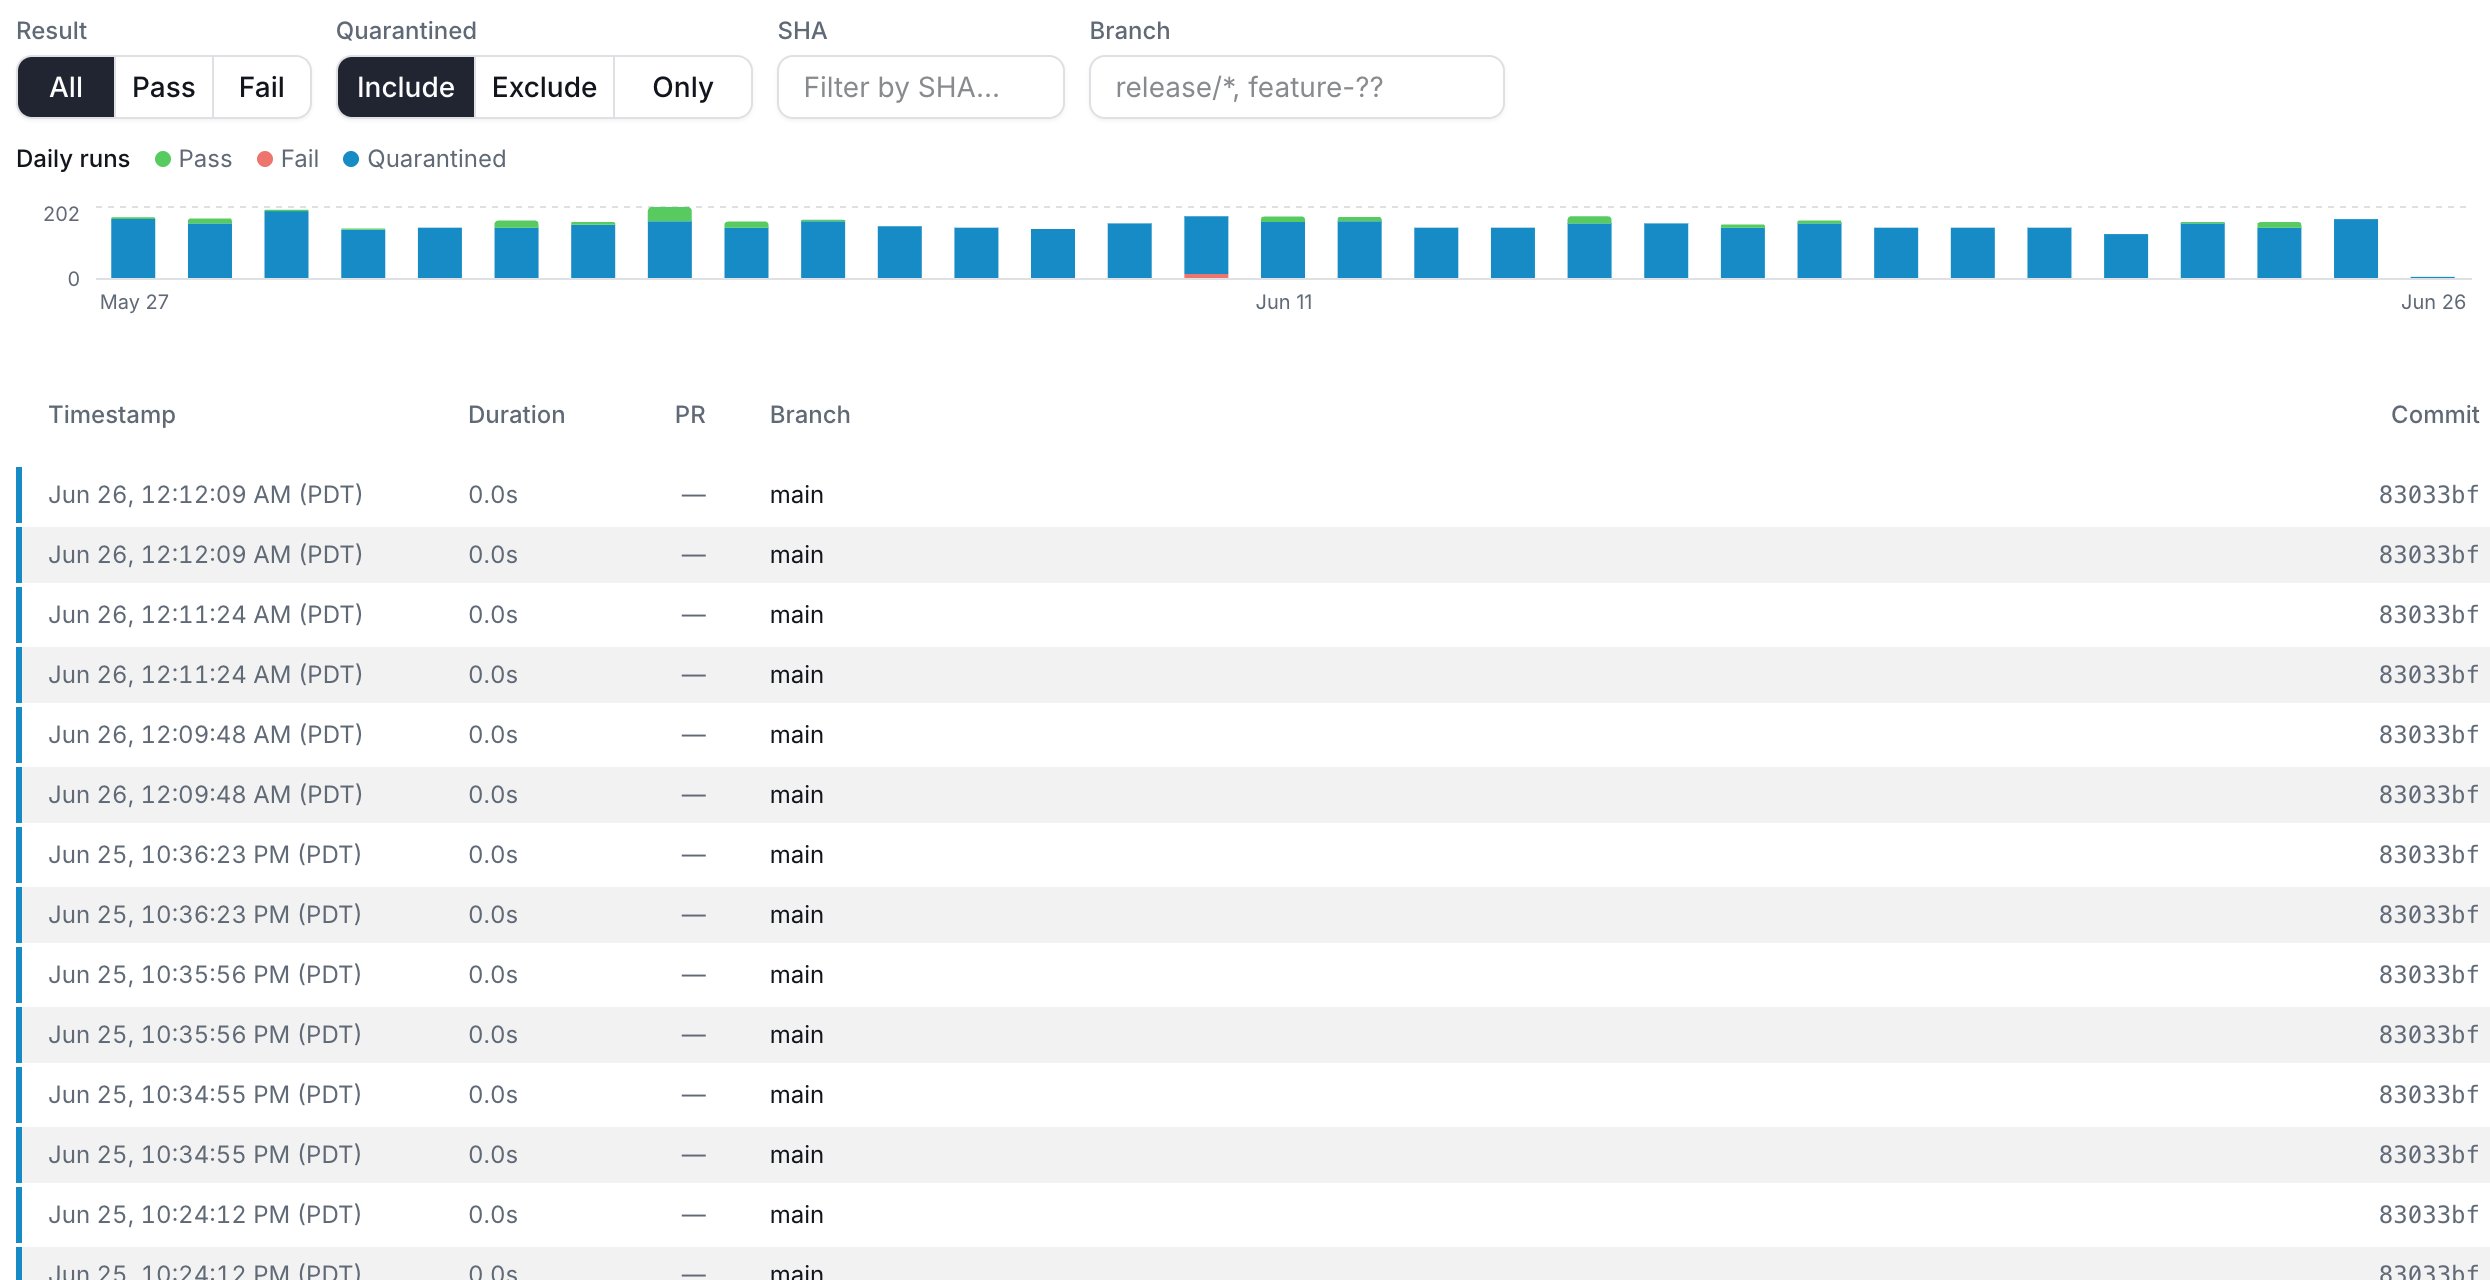
Daily runs chart
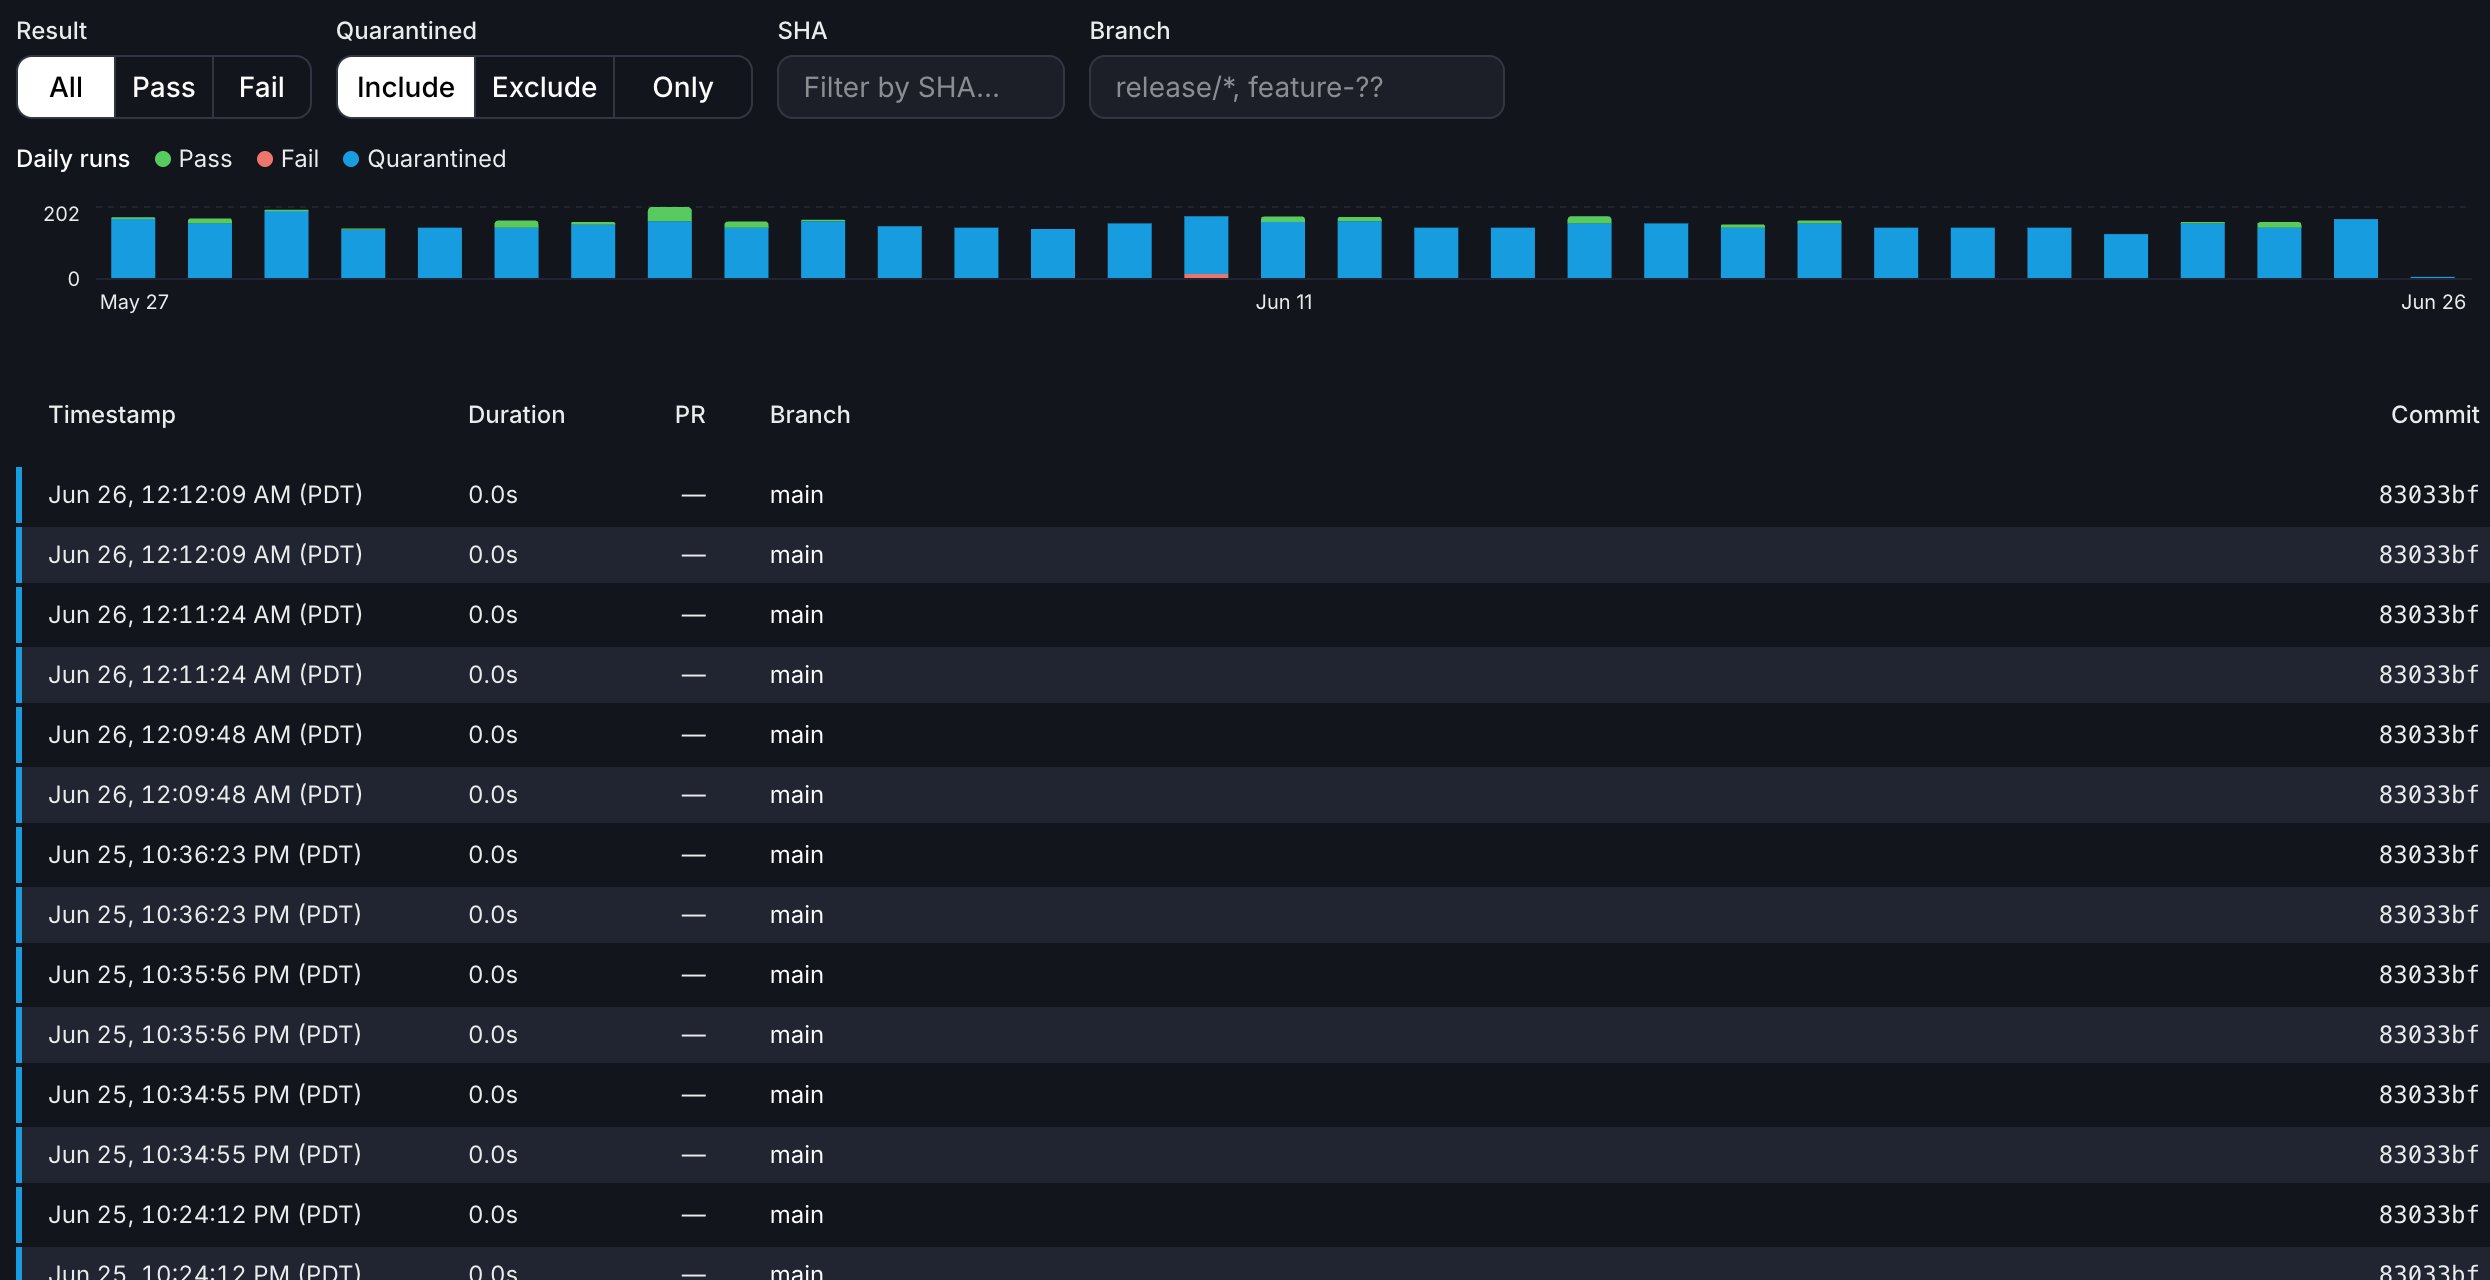
A stacked bar chart at the top of the tab shows daily test run counts. The legend identifies four categories:- Green: Pass
- Red: Fail
- Blue: Quarantined
- Gray: Skipped
Filters
A filter bar below the chart provides four independent controls:
Branch filter examples:
All filters combine using AND logic, so you can use them together. For example, set Result to Fail and Quarantined to Only to surface only quarantined failures. The Reset button clears every filter at once, including the chart date range.
Filter state is saved in the URL, so you can share or bookmark a filtered view. The Result filter accepts
result=pass or result=fail. The Quarantined filter accepts quarantined=include, quarantined=exclude, or quarantined=only.
Runs table
The runs table displays a paginated list of individual test runs (25 per page) with the following columns:
Each row has a colored left border indicating the run’s outcome. Quarantined runs always show blue, regardless of whether the run passed or failed. For non-quarantined runs, the border is green for pass, red for fail, orange for error, and a neutral gray for any other state.
Run detail panel
Click any row in the runs table to open a detail panel on the right side of the page. The panel shows:- Run header: Timestamp, a result badge (Pass, Fail, Error, or Quarantined), and run duration.
- Source control: A CI job link (with the provider’s icon, the job name, and the CI duration), the linked pull request, branch, and commit. Merge queue runs also include a View in Merge Queue link.
- Error details: For failed, errored, or quarantined runs, an optional AI summary of the failure followed by the raw error text or stack trace.
Debugging a flaky test from the UI
The Summary tab, failure details, and Test History tab give you most of what you need to investigate a flaky test. A few gaps come up often enough to call out, along with the workarounds that exist today.Drilling into the right parallel worker
The CI job link in the run detail panel points to the parent build, not the specific worker that produced the failure. If your CI runs a single job, this is fine. If you fan out across many parallel workers (some customers run 40+), you’ll have to click through workers in the CI provider to find the one whose log contains the failure. To shortcut this, capture the per-worker URL at test run time and include it in your JUnit output so it surfaces in the failure detail. Most CI providers expose an environment variable for the running job’s URL:
Read the value at the start of the test job and append it to a test property, log line, or system-out block in your JUnit XML. The link then appears alongside the failure in Trunk instead of routing to the parent build.
Bundle Upload ID lookups
When thetrunk-analytics-cli uploads a bundle, it prints a Bundle Upload ID to the job log. This ID does not currently map to a URL in the web app — there’s no search field for it in the dashboard. If you need to trace a specific upload back to its run data, contact support with the Bundle Upload ID.
Uploads are processed periodically, not in real time, so a run you just uploaded may not appear immediately. If it isn’t visible yet, wait and refresh before assuming the upload failed.
CI artifact retention
CI providers typically retain build artifacts (screenshots, videos, traces) for one to two days. Flaky test tickets often take longer than that to investigate and resolve, which means the artifacts that would have helped explain the failure may already be gone by the time you open the ticket. If artifacts matter for your debugging flow, store them outside the CI provider’s retention window:- Upload screenshots, videos, and traces to S3 (or another long-lived store) as a CI step, and include the object URL in the JUnit output alongside the per-worker URL described above.
- For especially noisy tests, attach the artifact URL to the Jira/Linear ticket Trunk opens via the ticketing integration.
Known limitations
A few framework-specific quirks are worth knowing about up front.RSpec
MultipleExceptionErrorWhen an example raises multiple exceptions (for example, an error in the test body plus a separate error in an after hook), RSpec wraps them in RSpec::Core::MultipleExceptionError. The rspec_trunk_flaky_tests gem already uploads the full set of captured exceptions; the failure detail view currently renders only one of them. To see all of them, check the CI job logs for the full exception list when you encounter this error type.Go subtests with 0ms duration
go test reports the top-level test duration but does not always emit per-subtest durations. When a subtest’s duration is reported as 0ms, timing-based signals — including the AI failure analysis — have less to work with for that case. If timing context matters for your investigation, post-process your JUnit XML to reflect real subtest durations before uploading, or rely on the raw stack trace rather than the AI summary.